Authored by Kefelegn Kebede*,
Abstract
The study aimed at assessing variability among biometrical traits, deducing components that describe these traits, and predicting body weight from both original and orthogonal traits using regression models. Body weight and nine biometrical traits namely, comb height, comb length, keel length, wattle length, body length, back length, breast circumference, wingspan, and shank length were measured on 720 (237 males and 483 females) randomly selected and extensively managed chickens. Phenotypic correlations among body weight and biometrical traits were positive and very highly significant (r = 0.51-0.93; P<0.0001). In the varimax rotation principal component (PC) factor analysis, two factors were extracted which accounted for 88.9% of the total variation. PC1 loaded heavily on comb length, wattle length, comb height, wingspan, shank length, and body length while PC2 loaded heavily on breast circumference and back length. When utilized as predictors in regression analyses, the interdependent biometrical traits had accounted for 82% variation in body weight. However, multicollinearity problem was existent in this estimation. Utilizing the extracted two factor scores as predictors, on the other hand, had positive significant effects on body weight, accounting for 78% variation in body weight. The use of factor scores provided better and reliable prediction of body weight as multicollinearity problem was handled and eliminated. The results found could be used as selection criteria for improving body weight of local chickens.
Keywords: Biometrical traits; Chicken; Principal Component Factor Analysis.
Introduction
Ethiopia is endowed with many livestock species with an estimated population of 62.6 million cattle, 31.7 million sheep, 33.0 million goats, and 61.5 million poultry FAOSTAT [1]. The country is owning a large number of poultry species which have lived, adapted and produced for many years in the country Tadelle [2], Halima [3] and Aberra and Tegene [4]. The local chicken genetic resources being the commonest to find, are in the hands of resource-poor farmers who rear these birds under the traditional husbandry system. This system in the rural areas plays a vital role in the rapidly growing economy of the country. It contributes in multiple ways to the livelihood and food security of the rural family Solomon [5]. Body weight had always been a trait of economic importance to livestock farmers. Knowledge about the relationship between body weight and biometrical traits is very important for poultry breeding, as biometrical traits have been found useful in contrasting size and shape of animals Mckracken [6], Ajayi [7].
Multiple linear regression (MLR) analysis has been used to interpret the relationship among body weight and biometrical traits in some animals Cankaya, Ogah [8]. Interpretation of results obtained from MLR analysis may be inaccurate due to the problem of multicollinearity Eyduran [9]. Consequently, PC factor analyses are used to reduce a large number of variables to a smaller number of factors for modelling purposes (Tabachnick and Fidell). This involves the use of PC factor scores as predictors of body weight in MLR models, thereby handling and eliminating multicollinearity problem (Grice, 2001).
Despite the rich genetic resource base of local chickens in Ethiopia, there is little information on its characterization using multivariate analysis approach. Therefore, the present study aimed at assessing variability among biometrical traits, deduce components that describe these traits and predicting body weight from both original and orthogonal traits using PC factor analysis.
Materials and Methods
Description of the study area
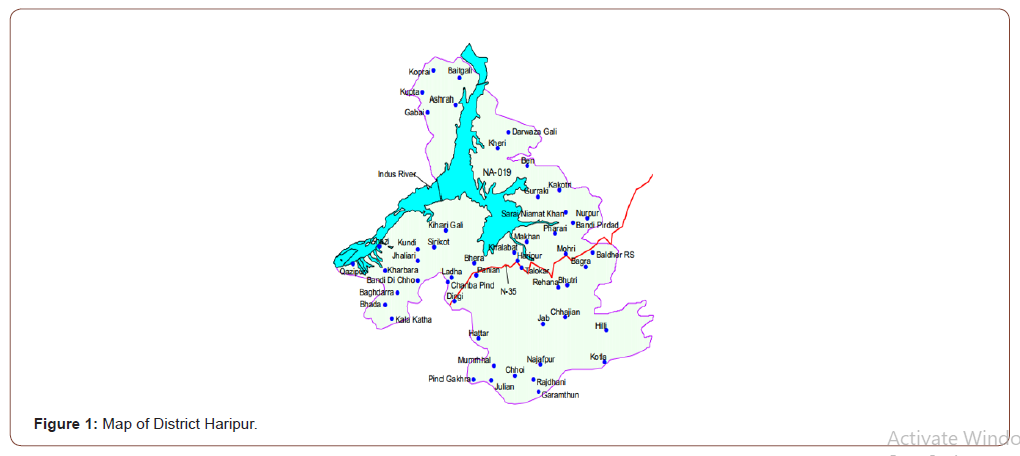
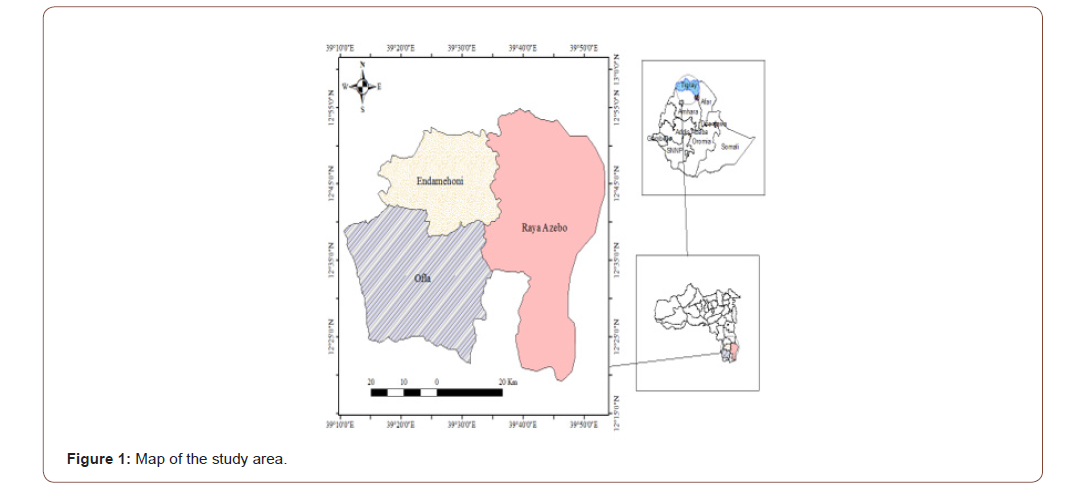
This study was conducted in the southern zone of Tigray which is located in the northern part of Ethiopia. It has an altitude ranging from 930 to 3925 m.a.s.l. The mean annual temperature varies from 9 0C to 28 0C; while the mean annual rainfall ranges from 400 to 912 mm. The southern zone of Tigray has eight districts from which this study focused on three districts: Raya-azebo, Endamehoni and Ofla (Figure 1).
Methods of sampling and data collection
A total of 720 local chickens of age six months and above (240 chickens (72 males and 168 females) from Raya-Azebo, 240 chickens (78 males and 162 females) from Endamehoni and 240 chickens (87 males and 153 females) from Ofla) were randomly selected. Body weight and biometrical traits (comb height, comb length, keel length, wattle length, body length, back length, breast circumference, wingspan, and shank length) were recorded following the recommended FAO descriptors for chicken genetic resources FAO [10]. Measuring tapes and a digital balance of 1g precision were used to measure the respective biometrical traits and body weight of sampled chickens.
Statistical data analysis
All statistical analyses were performed using SAS 9.4 software (version 9.4; SAS Institute Inc., NC). In livestock, such studies are mainly carried out on females due to their larger numbers Bene [11] Ndumu [12] and Traore’ A [13]. Thus, in this study, in order to avoid potential sampling bias due to the low number of males, only females were considered in the analysis.
Exploratory data analysis
The body weight and biometrical traits were subjected to exploratory data analysis to get results of descriptive statistics and correlation matrices using the PROC UNIVARIATE and PROC CORR procedures of SAS (version 9.4; SAS Institute Inc., NC).
Principal component (PC) factor analysis
Estimating the number of PCs
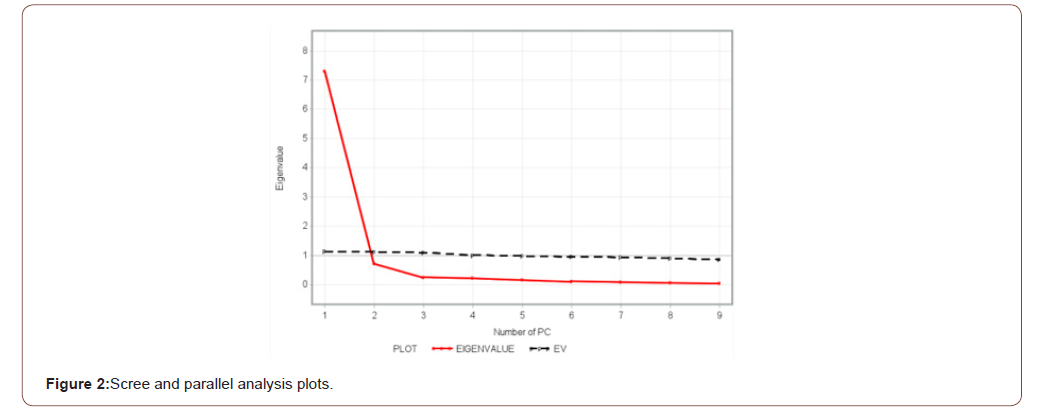
Several criteria are available for determining the number of PCs to be extracted. In this study, the criteria Kaiser–Guttman rule, the screen test, and parallel analysis plot were used.
PC loadings
These are correlation coefficients between the PC scores and the original traits. A high positive correlation between PC1 and a trait indicates that the trait is associated with the direction of the maximum amount of variation in the dataset. A strong correlation between a trait and PC2 indicates that the trait is responsible for the next largest variation in the data perpendicular to PC1, and so on.
Multiple linear regression (MLR) models
MLR procedure was used to obtain models for predicting body weight from interdependent biometrical traits (i), and from independent PC factor scores (ii)
BW = b0 + b1X1 + … + bkXk (i)
BW = b0 + b1PC1 + … + bkPCk (ii)
where, BW is the body weight, „bo‟ is the intercept, b1 is the with partial regression coefficient of the with biometrical trait, Xi or the with PC.
Results and Discussion
Exploratory data analysis
(Table 1) shows the mean ± standard error, standard deviation, coefficient of variation, minimum, and maximum estimates of body weight and biometrical traits of the chickens.
Table 1: Descriptive statistic results of body weight and biometrical traits.
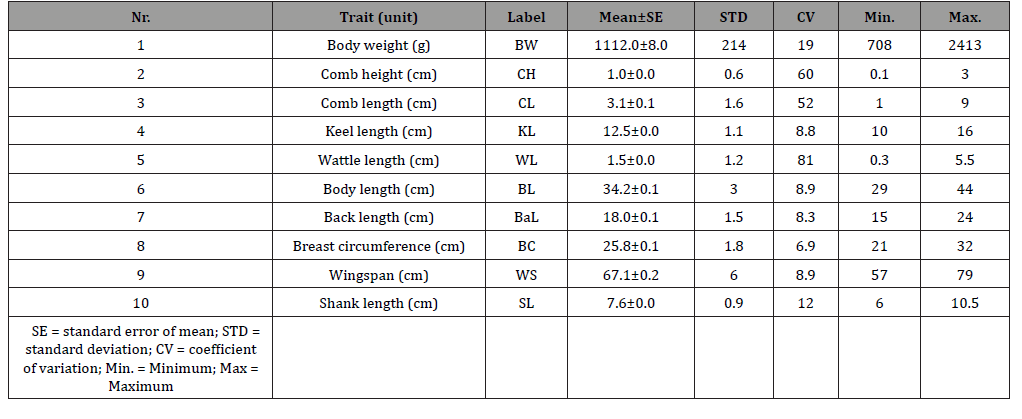
The mean body weight was 1112 g while the biometrical traits were 1.05 cm (CH), 3.11 cm (CL), 12.53 cm (KL), 1.46 cm (WL), 31.18 cm (BL), 18.05 cm (BaL), 25.81 cm (BC), 67.07 cm (WS), and 7.60 cm (SL), respectively. Wattle length varied most (CV = 80.8 %) while breast circumference (CV = 6.9 %) varied the least. The descriptive statistics results found in this study agree with earlier reports by Eskindir [14] and Getachew [15].
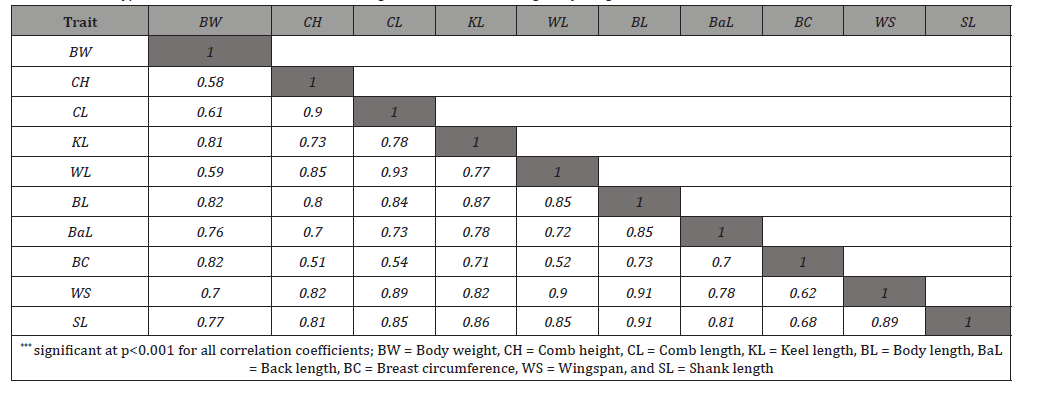
The degree of linear association among the biometrical traits measured by the Pearson correlation coefficient (r) and their statistical significance are presented in Table 2. The correlation coefficients varied from 0.51 (between BC and CH) to 0.93 (between WL and CL). Among 45 possible pairs of correlations, all pairs of correlations were found positive and significant, indicating that the data is suitable for performing PC factor analysis. Such positive and very highly significant correlation coefficient values have also been reported in chickens by the studies of Eskindir [14] and Getachew [15].
Table 2: Phenotypic correlations and their statistical significance levels among body weight and biometrical traits of chickens***.
PC factor analysis
Anti-image correlations computed showed that partial correlations were low, indicating that true factors existed in the data. This was further supported by Kaiser-Meyer-Olkin (KMO) measure of sampling adequacy, which was found to be sufficiently high with a value of 0.782. Eyduran [9] reported that a KMO measure of 0.60 and above is considered adequate. Bartlett’s sphericity test for testing the null hypothesis that the correlation matrix is an identity matrix was used to verifying the applicability of PCA. The value of Bartlett’s sphericity test was significant (p-value = 0.001), implying applicability of PC factor analysis used to the data set. Eigenvalues, percentage of total variance with rotated component matrix and communalities Table 3 shows the eigenvalue of the total variance, the rotated component matrix and communalities of the biometrical traits investigated. The table shows how much of the total variance of the observed traits is explained by each of the PCs after varimax rotation of the component matrix. Two PC common factors were identified with eigenvalues of 7.97 (PC1) and 0.91 (PC2). PC1 explained 79.7 % of the total variance while PC2 explained only 9.1 %. Accordingly, the first two PC factors combined accounted for 88.9 % of the total variability present in the parameters measured. The communalities are the proportion of variance that each variable has in common with other variables. Thus if the communality of a trait is high, it means that the extracted factors explained a big proportion of the variance the trait. The communality values ranged from 0.81 (BaL) to 0.94 (CL) indicating that the data are conformable to PC factor analysis.
Table 3: Eigenvalues and shares of total variance along with factor loadings after varimax rotation and communalities.
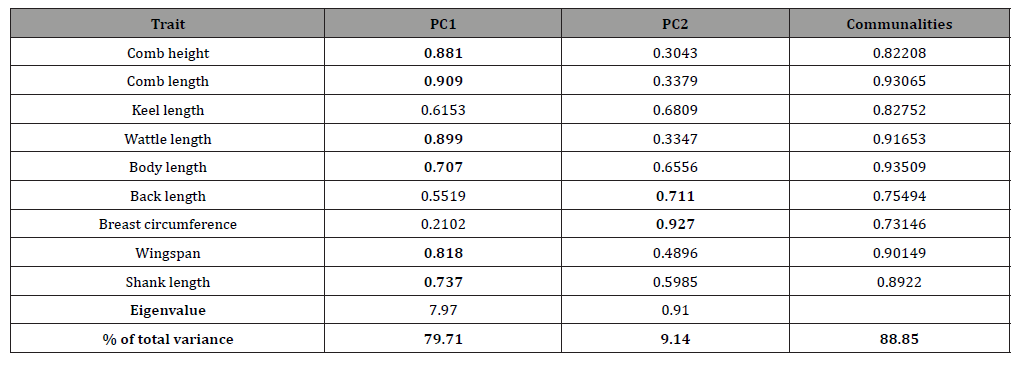
PC loadings presented in Table 3 are the correlation coefficient between the first two PC scores and the original traits. They measure the importance of each biometrical trait in accounting for the variability in the PC. That is, the larger the loadings in absolute terms the more influential the variables are in forming the new PC and vice versa. The first factor (PC1) loaded heavily on comb length (0.91), wattle length (0.90), comb height (0.88), wingspan (0.82), shank length (0.74), and body length (0.71) while the second factor (PC2) loaded heavily on breast circumference (0.93), and back length (0.71). The loading classification found in this study is somewhat similar to those reported by Uda Yakubu [16] and immature Uda Salako [17]. A scree-parallel analysis plot of eigenvalues against their PCs is shown in Figure 2 below. The plot demonstrates the distribution of variance among the components graphically. For each PC, the corresponding eigenvalue is plotted on the y-axis. By definition, the variance of each component is less than the preceding one. Here there appears to be a marked decrease in downward slope after the second PC implying that one can summarize the nine biometrical traits by the first two PCs.
Body weight prediction of chickens from morphometric traits and their independent PC factor scores
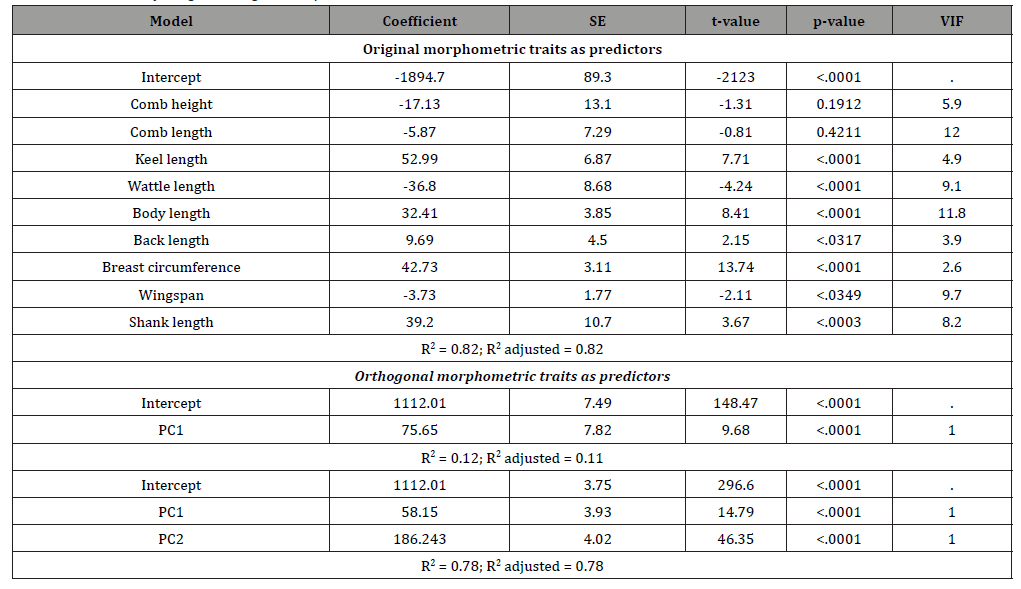
The interdependent original biometrical traits and their independent PC factor scores were used to the predict body weight of chickens. Table 4 presents the regression coefficient, their standard errors, t-value, p-values, variance inflation factor (VIF) values, and R2 obtained from MLR analysis. The regression of body weight on KL, WL, BL, BaL, BC, WS, and SL was significant, while it was not significant for CH, and CL. When utilized as predictors in regression analyses, the interdependent biometrical traits had accounted for 82% variation in body weight. These findings are consistent with the findings of Eskindir [14] and Getachew [15] in chickens. The genetic improvement of body weight is necessary in order to increase meat yield and egg yields of chickens, and this requires adequate knowledge of correlated traits that can be considered when selection is to be applied. However, the use of interdependent predictors should be treated with caution, since multicollinearity is associated with unstable estimates of regression coefficients Ibe body length were having VIF values greater than 10. Rook [21] stated that VIF values above 10 indicate severe collinearity which leads to unstable estimation of the regression coefficient. To overcome this limitation, the use of PC factor scores for prediction of body weight as predictors is used Keskin [22], Ogah [8], Yakubu [16]. These PCs are orthogonal to each other and are more reliable in body weight prediction. In the present study, the use of PC1 as a single predictor explained 12 % of the total variability in body weight. However, PC1 and PC2 together accounted for 78 % of the variation in body weight of the chickens. The two factors selected were found to have significant (p<0.0001) positive linear relationship with body weight (Table 4). In other words, body weight will be expected to increase as the values of factor 1 and 2 scores increase.
Table 4: MLR of body weight on original morphometric traits and their PC factor scores.
Conclusions
PC factor analysis was used in this study to assess variability among biometrical traits, deduce components that describe these traits, and predict body weight from both original and orthogonal traits using MLR models. The technique extracted two PCs that could aid in selection and breeding programmes. The traits accounted for PC1 are comb length, wattle length, comb height, wingspan, shank length, and body length; while for PC2 the corresponding traits were breast circumference, and back length [23-26].
The use of independent orthogonal indices (PC1 and PC2) derived from factors’ score was more appropriate than the use of original interrelated biometrical traits for predicting the body weight of chickens, as multicollinearity problems were eliminated. The two factors extracted from the present investigation could be used to select animals based on a group of variables rather than isolated traits.
To read more about this article...Open access Journal of Animal Husbandry & Dairy Science
Please follow the URL to access more information about this article
To know more about our Journals...Iris Publishers


