
Authored by Tamer Eljufout*,
Abstract
The deflection progression of Reinforced Concrete (RC) beams under cyclic loads gives a reliable indication of the accumulation of fatigue damages. Excessive increase in deflection raises a red flag for an immediate need for rehabilitation. This paper presents an analytical model for predicting the deflection evolution of RC beams strengthened with Near Surface Mounted (NSM) Fiber Reinforced Polymer (FRP) reinforcement. The model was validated based on experimental and numerical analyses. A three-dimensional strengthened RC beam was modeled using ANSYS software with similar dimensions and material properties of specimens that were experimentally tested. Numerical simulations were performed for the RC beam under constant amplitude cyclic loads. The analytical model predicted the increase in deflection due to the cyclic creep of concrete during the fatigue life of RC beams. A satisfactory correlation and consistency were noticed between the numerical and analytical predictions with a mean error of deflection less than 9.5%..
Keywords: Bridges; RC beams; Fatigue; Finite element analysis; NSM
Introduction
Many RC bridges all over the world are approaching the end of their design life. Therefore, bridges safety has been in the spotlight to prevent any serious structural problems that might lead to loss of life [1,2]. Efficient and practical strengthening techniques are needed to prevent potential disasters. FRP composite materials have proven their effectiveness in the strengthening of existing structures [3-6]. The development of deflection of RC beams gives a reliable indication of the damage accumulation along with the service life. Different factors affect the deflection progression of a RC beam, such as concrete creep, shrinkage, fatigue, overloading, and environmental exposures. Fatigue is the most critical factor that might cause a sudden failure to structural members. External bonded (EB) and NSM are the most common practical application techniques of FRP materials. These techniques are becoming extensively used in the strengthening field of RC bridges [7]. The fatigue behavior of the NSM CFRP strengthening technique is still not fully investigated. Moreover, the current design codes and guidelines do not provide practical design guidelines for structural engineers to predict the fatigue behavior of RC beams strengthened with NSM FRP [8]. This study investigates the ability of the analytical model proposed by Balaguru & Shah [9] for predicting the deflection response of RC beams strengthened with NSM FRP reinforcement under cyclic loading.
The Analytical Model
Balaguru and Shah [9] proposed an analytical model for predicting the accumulation of deflection of non-strengthened RC beams subjected to cyclic loading. The model ignores different factors, such as the shrinkage effect, concrete mix proportion, and the age at loading. The deflection of a RC beam is calculated on the basis of the effective moment of inertia taking into consideration the reduction in stiffness due to the creep strain after several load cycles. Based on their model, the increase of deflection is attributed to the concrete creep in the compression zone, reduction in stiffness due to the flexural cracks, and the strain-softening of steel reinforcement.
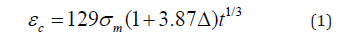
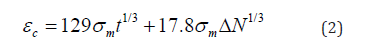
The cyclic creep strain of concrete can be expressed as determined by Whaley and Neville [10]:
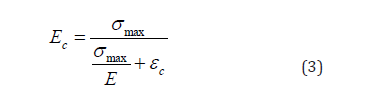
The previous equation is used to develop a cycle-dependent secant modulus for concrete in compression as follows:
A cycle-dependent secant modulus of concrete under compression is presented by:
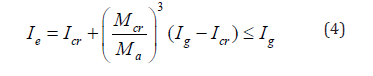
The reduction in stiffness of RC beam due to the fatigue tensile cracking and debonding must be considered. The effective moment of inertia expressed as:
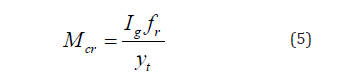
The cracking moment is giving by:
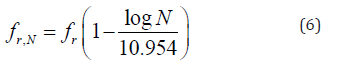
The stiffness of the strengthened RC beam is reducing with the increase of the number of cycles. The relation between the initial modulus of rupture and its value at a given number of cycles is:
The deflections of short-term static loading are calculated as follows:
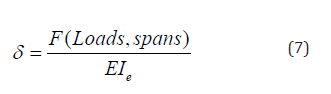
Where 𝐹 (Loads, spans) is a function of the load and span arrangement, and 𝐸𝐼𝑒 is the initial effective stiffness of the RC beam.
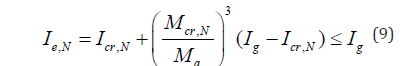
The deflection after a given number of cycles is presented as:
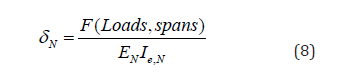
Where 𝐼𝑒,𝑁 is given by:
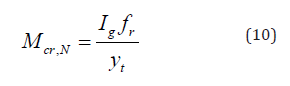
The cracking moment at a given number of cycles is:
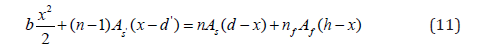
The classical beam theory can be used to determine the stress distribution along the RC beam section, as shown in Figure 1. The contribution of FRP reinforcement is considered similar to the contribution of steel reinforcement. The depth of the neutral axis (x) was found using the force equilibrium along the beam’s section, as follows:

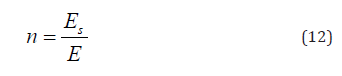
The modular ratio of steel reinforcement is given by:
The modular ratio of FRP reinforcement is given by:
The gross moment of inertia is given by:
The moment of inertia of the cracked section is calculated by:

The Numerical Model
A strengthened RC beam was modeled with similar dimensions and material properties of specimens that were experimentally tested by Eljufout and Toutanji [11]. A three-dimensional finite element RC beam was modeled using ANSYS (2015). The static and fatigue tools in ANSYS were utilized in this study. The fatigue tool allows the determination of fatigue damage and life using a stress- life or strain-life approach. Static analyses were performed to calibrate the simulated RC beam. The fatigue analysis was performed in increments to obtain the model’s responses along with the fatigue life. The obtained data includes the deflection and strain progression with respect to the number of cycles.
The model has a total length of 1221mm and a square crosssection with a width and depth of 152.4mm. The steel reinforcement consists of four 12mm diameter rebars, two rebars in the tension zone and another two rebars in the compression zone. The RC beam is strengthened with a 9.6 mm diameter CFRP rod placed in the beam’s soffit, Figure 1. The fatigue properties of the modeled RC beam were defined based on the empirical S-N curves that were developed in the study done by Eljufout and Toutanji [11] for RC beams strengthened with NSM CFRP. The model is a simply supported beam according to the configuration of experimental tests. An end of the beam was modeled as a hinge support that is constrained in both horizontal and vertical direction. Whereas the other end was modeled as a roller support that is constrained only in the vertical direction. A steel plate was modeled to simulate a two-point bending spreader beam. This allows the applied load to transfer in a constant form of pressure. Steel plates and supports were assumed to have a perfect bonding with the concrete.
Due to the symmetry of the RC beam and the testing configuration, only half of the RC beam was modeled with the proper boundary conditions to reduce the computational time and the needed storage of data. The RC beam’s symmetry was simulated by restraining the displacement in the plane perpendicular to the plane of symmetry. A convergence study was performed to determine the appropriate element size. The Newton-Raphson approach was utilized for the nonlinearity of the model during the static analysis (Figure 2).

The concrete and epoxy used in this study were considered as quasi-brittle materials with different responses under compression and tension loads. The SOLID65 element was employed to model concrete and epoxy resin. This element has eight nodes with three degrees of freedom at each node, translations in the nodal x, y, and z directions. Moreover, the element is capable of predicting the nonlinear behavior using a smeared crack approach, which allows the model to simulate the concrete and epoxy resin failure modes accounting for both cracking in tension, crushing in compression, plastic deformation, and creep in three orthogonal directions [12]. The element requires linear and multilinear isotropic material properties. Thus, the ultimate compressive and tension uniaxial strengths are needed to define the failure criterion of concrete and epoxy resin. Von-misses’ criteria were considered based on the study performed by William and Warnke [13]. The SOLID65 element starts cracking once any of the principal tensile stresses in any direction exceed the maximum defined tensile principal stress of the defined material. Likewise, the element starts crushing once the principal compressive stresses exceed the defined maximum compressive stress. The condition of the crack face was presented by the shear transfer coefficients for an open and closed crack, and was 0.3 and 0.8, respectively. Typical shear transfer coefficients range from 0.0 to 1.0, where 0.0 represents a smooth crack (complete loss of shear transfer) and 1.0 representing a rough crack (no loss of shear transfer).
Different analytical models have been proposed to predict the stress-strain response of a brittle material. The analytical model that was proposed by Ali et al. [14] was used in this study. Concrete has a perfect linear elastic behavior within the first third of its ultimate compressive strength. After reaching the ultimate strength, concrete starts to soften and crushing. The complete failure occurs once the concrete reaches the ultimate strain. The SOLID65 element was defined accordingly to avoid convergence problems. The required stress-strain curve was developed based on the ultimate compressive strength obtained by experimental tests and using the following equation:
The modulus of elasticity and tensile strength were calculated by the following equations [15]:
All the defined properties in equations (17) and (18) are in mega-pascal (MPa). The flexural and shear reinforcements were included in the RC beam model. The steel and CFRP reinforcements were modeled by a LINK180 element. This element is a three degrees of freedom spar element with two nodes, and it has the ability for translations in the nodal x, y, and z directions. The element is capable of plastic deformation and it was modeled as an elastic-linear hardening material BKHM (Bilinear Kinematic Hardening Model), and identical in tension and compression. A perfect bonding was assumed between concrete, steel rebars, and CFRP reinforcement.
Table 1: Material properties of concrete and steel reinforcement.

The SOLID45 element was used for modeling the rigid steel support and loading plate. This element has eight nodes with three degrees of freedom at each node, translations in the nodal x, y, and z directions. This element was assumed to be a linear elastic material with an elastic modulus of 188 GPa and Poisson’s ratio of 0.3. The steel support and loading plate were modeled to obtain a constant stress distribution along the element’s cross-section. This helps to maintain a better convergence by avoiding concrete crushing. Both the steel support and loading plate have the same dimensions of 152.4 mm × 60 mm × 30 mm. Tables 1 & 2 present the material properties of the RC beam.
Table 2: Material properties of epoxy and CFRP reinforcement.

Discussion
The model was validated under monotonic and fatigue loading with respect to the experimental results that were obtained in a study done by Eljufout and Toutanji (10). The model responses correlate satisfactorily with the experimental data at all stages of the monotonic and cyclic loading [16,17]. A comparison between the obtained numerical and experimental static behaviors is presented in Figure 3. Two significant stages can be characterized in the static behavior of the RC beam; linear elastic stage and nonlinear ultimate stage. The experimental yield load was determined as 105.3 kN at a deflection of 10.0mm. The numerical yield load was 106.2 kN at a deflection of 10.6mm.

The model was subjected to a constant cyclic load ranges of 31 kN and 46 kN, Figures 4 & 5. A good precision was noticed between the FE simulations and experimental tests. The maximum deviation between the numerical and experimental results for deflection under cyclic loading is less than 17%.


Numerical and analytical analyses were carried out for four strengthened RC beams. Specimens “B01”, “B02”, “B03”, and “B04” were subjected to 31, 36, 41, and 46 kN cyclic load ranges, respectively. The obtained strain of tension steel reinforcement was less than that observed during the experimental tests. The deflection of the analyzed RC beams was accumulating with the applied load cycles. All specimens experienced an initial rapid increase of the mid-span deflection, then followed by a steady rate of deflection accumulations. The deflection exhibited a dramatic increase just before failure in both the experimental and numerical simulations [18,19].
Table 3 summarizes the obtained results of the deflection progression of numerical and analytical analyses. The mean numerical to analytical deflection ratio is 0.92 with a standard deviation of 0.3 mm. Comparison of the obtained mid-span deflection and strain of tension steel reinforcement is presented in Figures 6 & 7 for specimens “B02” and “B03”. The analytical model predicted the increase in strain due to the cyclic creep of concrete along with the fatigue life of RC beams. A good correlation was noticed of specimens “B01” and “B04”. The analytical and numerical predictions of deflection development for specimens “B02” and “B03” was consistency along with the fatigue life. The analytical predictions of deflection increase gradually with the increase of applied cycles. The predicted values of deflection are close to the numerical results at all stages of the fatigue life and under different loading conditions. The mean error of deflection is less than 9.5%. The error is calculated by dividing the absolute difference between the predicted and measured values of deflection over the measured value.
Table 3: Comparison of the obtained deflection progression.


Conclusion
An analytical model was employed to predict the development of deflection of RC beams strengthened with FRP reinforcement under cyclic loading. With reference to the numerical and analytical analyses that were performed, the following conclusions can be drawn:
• The analytical model proposed by Balaguru & Shah (6) gives practical predictions of the deflection development of RC beams strengthened with NSM reinforcement. The obtained results are in good agreement with the experimental and numerical results.
• RC beams strengthened with NSM CFRP reinforcement degrade gradually with the increase of the number of cycles based on the predictions that are given by the numerical and analytical analyses.
To read more about this article...Open access Journal of of Engineering Sciences
Please follow the URL to access more information about this article
To know more about our Journals...Iris Publishers


