Tuesday, February 28, 2023

Iris Publishers-Open access Journal of Archaeology & Anthropology| Ancient Iron-Smelting Site “East Hungai” on Olkhon Island (Lake Baikal, Russia): Rock-Magnetic Approach to Archaeological Problems


Authored by Galina G Matasova*,

Abstract

Rock-magnetic techniques were used to examine topsoil layer over the “East Hungai” archaeological site on Olkhon Island (Lake Baikal, Siberia) in an effort to determine the possible sources of magnetic anomalies associated with iron smelting activity at about the BC/AD boundary. Measurements of surface and subsurface magnetic susceptibility and laboratory measurements of hysteretic parameters have shown a magnetic heterogenity of strata resulted from the interaction of two factors: the initial differentiation of the bedrock source material and the high intensity of the sedimentary process that contributed to significant desintegration of bedrock and to easy transporting of the disintegrated products. Because bedrock on the east and west sides of the valley are different, the distribution of magnetic susceptibility over the excavation area is rather complex. Nevertheless, susceptibility anomalies corresponding to ore preparation and ore storage zones could be recognized. Most likely East Hungai site was used during prospecting works and trial iron smelting in promising places, which testifies the remarkable activity of ancient metallurgists on the western shore of Lake Baikal

Keywords: Rock-magnetic study, topsoil, magnetic susceptibility, ancient iron smelting, Olkhon Island, Lake Baikal

Introduction

In the recent decades, magnetometry became increasingly popular in the studies of archaeological sites (see e.g. [1, 2]). However, for its successful application it is necessary to have a priori information about the magnetic properties of both artifacts and the geological environment in which artifacts are located. Because, usually, contrasts in the magnetic characteristics of various objects vary in wide ranges, magnetic anomalies will also have different amplitudes and the interpretation of anomalies may be ambiguous [3-6]. In this case, a rock -magnetic study of archaeological sites provides information that is unavailable through more traditional geophysical techniques. It can answer not only archaeological questions about location of magnetic artifacts but also those regarding depositional and post depositional processes. Although rock-magnetic method has been used at some archaeological sites [5- 8], its potential as a new archaeological tool is still underestimated. Due to human industrial impact, magnetic properties of topsoil and/ or sediment may undergo specific changes [7]. The most dramatic changes are usually observed when studying ancient metallurgical sites [9-10]. Due to high temperatures of bloomery processes, the magnetic susceptibility of upper soil layers increases due to the neoformation of magnetic minerals (mainly magnetite) as a result of the baking of soil organic matter. Such changes allow revealing and mapping areas which in ancient times were exposed to high temperatures during iron smelting: slag heaps, baked zones, and zones of preparation of raw materials and of charcoal production. Therefore, the rock-magnetic study of archaeometallurgical sites is promising direction in archaeogeophysics.

In this paper, we describe and discuss rock-magnetic study of recently opened archeological site East Hungai on the Olkhon Island of Baikal Lake (Siberia). The site is represented by remains of bloomery, slag fragments and pieces of ceramics. The study was targeted at the following items:

i. to estimate the ‘background’ (typical for the area) magnetic susceptibility values;

ii. to determine whether there are magnetic susceptibility anomalies on the study site, and if they are, to find their possible sources; and

iii. to reveal possible regularities in the distribution of the magnetic material and a possible mechanism of its transport over the study area,

iv. to propose the ways of using rock-magnetic data to solve archaeological problems at the East Hungai site.

Materials and Methods

Site description and sampling

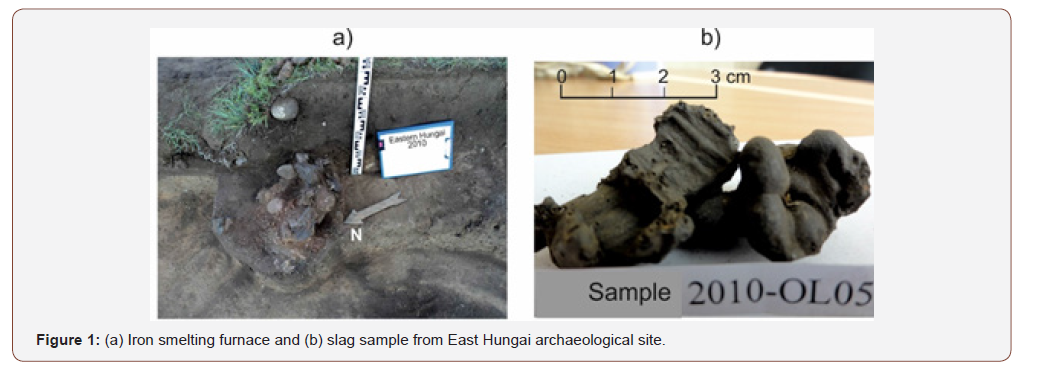
Archaeological site “East Hungai” is located on the eastern side of Hungay bay on the north-western bank of Olkhon Island (N 53º05’45’, E 107º13’30’). The site is located in a dry valley formed by gentle slopes of two low (elevation above Baikal Lake is less than 60m) hills. The site includes remains of an iron making furnace which is exposed in escarp of the first terrace of Baikal Lake and covers the adjacent territory about 150 square meters eastward from the furnace where a few slag fragments were found (Figure 1). The age of the iron-smelting industry at the East Hungai site is approximately defined from the end of the first millennium B.C. to the first half of the first millennium A.D by the analogy with metallurgical sites of Kurma and Barun-Hal [11-12]. These sites are located on the opposite shore of Lake Baikal in front of the East Hungai (Figure 1).
irispublishers-openaccess-archaeology-anthropology

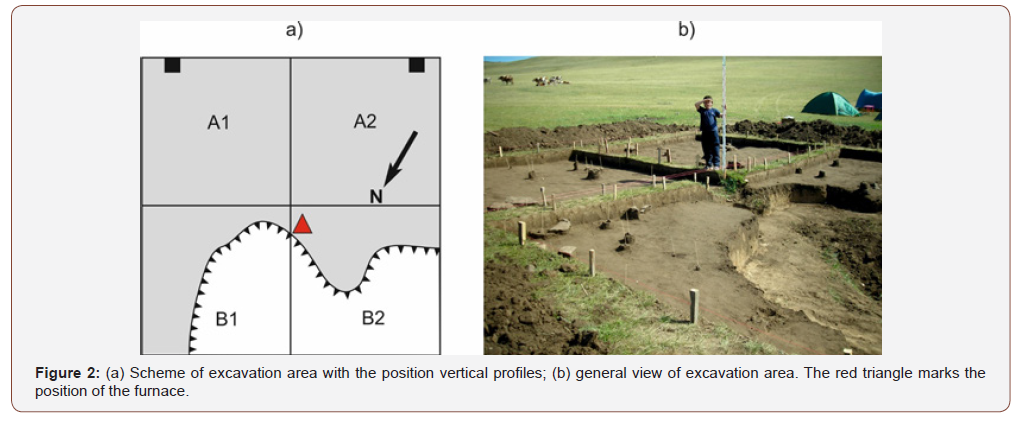
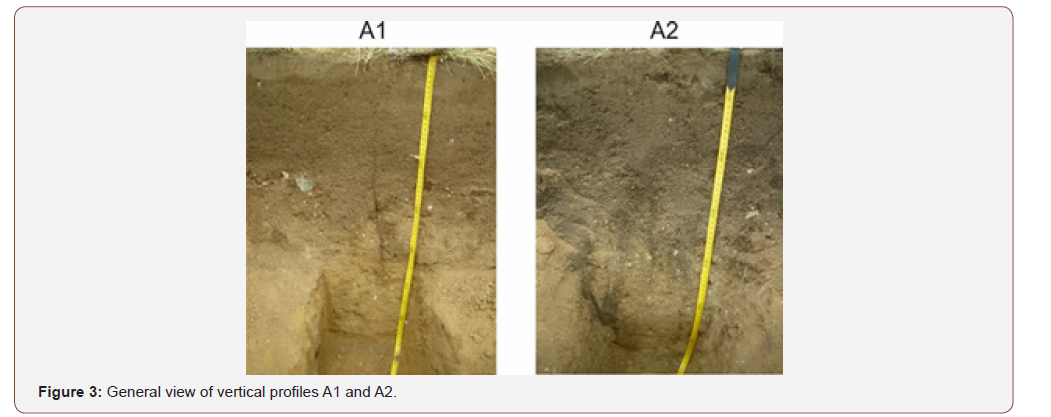
The excavation area of 10 × 10 meters was laid in the central part of the East Hungai archaeological site and is divided into four 5×5 meters squares, designated A1, A2, B1 and B2 (Figure 2). The boundary between A1, B1 and A2, B2 squares nearly coincides with the valley line. In addition, two vertical profiles were excavated in southern parts of squares A1 and A2, to a depth of 70 cm. Field measurements of magnetic susceptibility accompanied by rockmagnetic sampling for further laboratory studies were performed every 5 cm down the walls of the profiles (Figure 3).
irispublishers-openaccess-archaeology-anthropology

In-field surface measurements of magnetic susceptibility were carried out over all the area of the archaeological site excluding the slope beneath the scarp of the terrace in squares B1 and B2. Measurements were performed at three different hypsometric levels:

a. on the surface;

b. at a depth of 30 cm;

c. at a depth of 50 cm.

The measurements had different goals and, accordingly, were performed with different scales: on the surface - on a 1m×1m grid; at a depth of 30 cm - on a grid of 20cm×20cm; at a depth of 50 cm - on a grid of 50cm×50cm. Surface measurements were aimed at revealing the “background” magnetic susceptibility values for the given area and soil type. These values are needed for deciding whether or not there are magnetic susceptibility anomalies at the studied area. At the same time, recent sources of anomalies (metal objects left by tourists) were ignored, and the anomalies created such sources were not taken into account. Measurements of magnetic susceptibility at a depth of 30 cm were carried out in order to detect traces of ancient human activity by searching for magnetic susceptibility anomalies and recognizing their nature. In places where archaeological objects (slags, fragments of ceramics, bonfires) were found, the magnetic susceptibility was measured twice: before and after removing of anthropogenic objects, i.e. at first near the artifacts and than directly on the surface of the exposed layer free of artifacts. Measurements at a depth of 50 cm were performed to estimate variations in the subsoil layer magnetic susceptibility.

Magnetic measurements

Field measurements of magnetic susceptibility were carried out using KT-5 susceptibility meter. This instrument gives volumetric magnetic susceptibility of approximately 5×5×5 cm volume of the near-surface substance.

Laboratory measurements of mass-normalized magnetic susceptibility (χ) and its frequency dependence (FD %) were carried out using Bartington MS2 meter with the dual frequency probe MS2B. Hysteretic loops were recorded using a J_meter coercive spectrometer manufactured by KFPU (Kazan, Russia) [13]. From the measurement results the following magnetic parameters were calculated: remanent saturation magnetization (Jr); saturation ferromagnetic magnetization (Jf) free of paramagnetic input; paramagnetic magnetization (Jp) in the field of 700 mT; coercive force Bc and remanent coercive force (Bcr). Domain state of ferromagnetic grains was determined using Day/Dunlop biplot of Bcr/Bc and Jr/Jf ratios [14-15]. All measurements were made in accordance with generally accepted methods [7].

Results

Vertical profiles
irispublishers-openaccess-archaeology-anthropology

Both profiles have a similar structure which includes steppe soil: organic (O) and humic (A) horizons, illuvial horizon (B) and parent rock (C). They are represented by sand and sandy loam of slope-wash genesis (talus) with debris of bedrock of different size and composition (Figure 3).

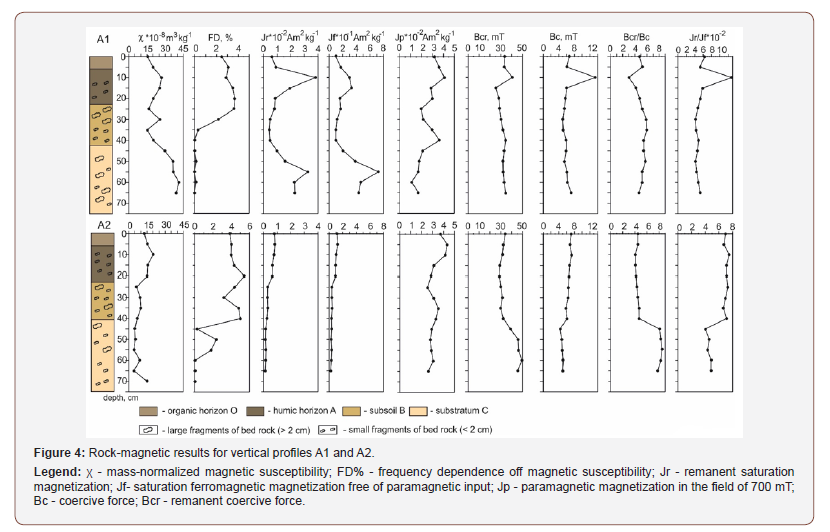
Despite the distance between profiles does not exceed 8 meters, the magnetic characteristics of soils and underlying sediments in squares A1 and A2 differ significantly (Figure 4). First of all, this concerns rock-magnetic parameters characterizing mainly the concentration of ferromagnetic material - magnetic susceptibility χ, magnetizations Jr and Jf. All of these parameters are, on average, 3-4 times higher in the profile of square A1 than in the profile of square A2. The dependence of these parameters versus depth also varies significantly (Figure 4).
irispublishers-openaccess-archaeology-anthropology

First, with a few exceptions (the third point on profile A1), the underlying strata in square A1 is much more magnetic than soil horizons, while in the square A2 - the situation is opposite. Secondly, the correlation between χ and Jr is significantly higher in the A1 square (r = 0.87) than in the A2 square (r = 0.65). Comparison of other magnetic characteristics reveals a similarity between the two profiles. The values and trends in the change of the magnetic susceptibility frequency dependence (FD factor) are approximately similar, but their correlations with the low-frequency χ in two squares are opposite: in both profiles, the correlation coefficients have close values but are opposite in sign (rA1 = -0.57; rA2 = 0.56). Variations in FD along profiles indicate the most intense process of formation (accumulation) of fine-grained magnetic minerals, the so-called superparamagnetic (SPM) grains occurs at a depth of 30- 40 cm, i.e. in the lower part of the soil profile and on the interface with the underlying layer.

The behavior of paramagnetic magnetization Jp in both profiles is approximately the same, which indicates the similar paramagnetic content and distribution of Jp versus depth: the highest concentration of paramagnetic minerals is observed in the upper (to a depth of 15 cm) horizons; with depth, it decreases gradually in the lower soil horizons and in the underlying layer (Figure 4).

The coercive characteristics (Bcr, Bc) also exhibit similar behavior and values on both profiles, but only in soil horizons (Figure 4). At the moment, there is no explanation for the behavior of these characteristics at point 3 of profile A1, therefore we consider it as an experimental error and exclude it from consideration. Bc and Bcr values throughout entire A1 profile practically do not change, their behavior is synchronous, with a correlation coefficient r = 0.75, while in the parent rock of A2 profile Bcr and Bc change in opposite manner with a correlation coefficient r = -0.78.

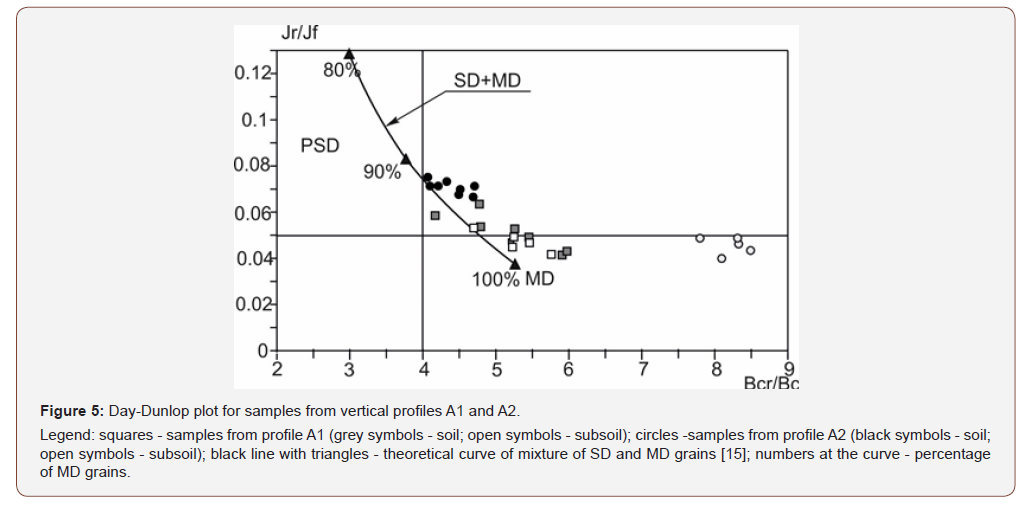
The biplot of Bcr/Bc and Jr/Jf ratios characterizes the predominance of multi-domain (MD) particles in the magnetic fraction in all sediments (Figure 5). In A1 profile, the difference between the soil horizon and parent rock is insignificant and the points on the Day plot occupy a compact area which corresponds to 100% content of MD grains (Figure 5). On the contrary, on the A2 profile soil samples show 90% MD content while parent rock samples are located far from the referent curve [15] due to enhanced Bcr/ Bc ratio values (Figure 5). It may be caused both by very coarse magnetic grains and mixture of MD and SPM grains.
irispublishers-openaccess-archaeology-anthropology
Surface magnetic measurements

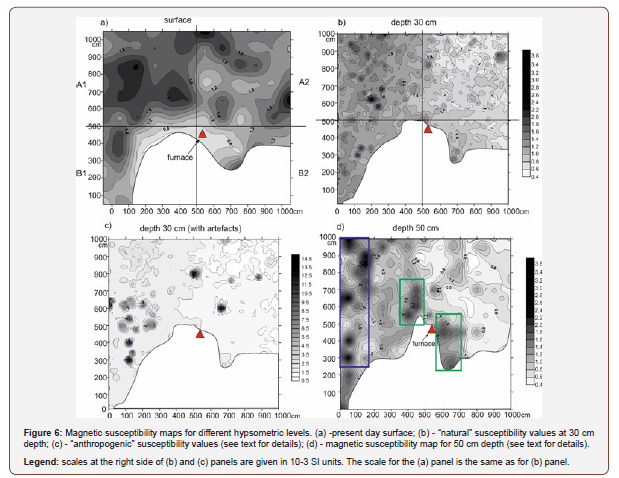
The results of magnetic susceptibility measurement for all three hypsometric levels (present day surface, depth 30 cm and depth 50 cm) are presented in Figure 6.
irispublishers-openaccess-archaeology-anthropology

The distribution of magnetic susceptibility over the excavation area completely fits the regularities revealed from the study of vertical soil profiles in Figure 3, where the average magnetic susceptibility, for example, of the underlying layer is 3-4 times higher in the square A1 than in the square A2. It is clearly seen that the eastern part of the archaeological site (squares A1, B1) exhibits enhanced values of magnetic susceptibility at all three levels. The area of enhanced magnetic susceptibility on the presentday surface in square A2 with the center at coordinates (X)1050, (Y) 650 is situated in area occupied formerly by tourist camp and is caused by the remains of a recent fireplace (Figure 6 a). This anomaly disappears at a depth of 30 cm and, accordingly, does not relate to natural phenomena. In the remainder of excavation area the distribution of magnetic susceptibility is probably determined by geological processes.

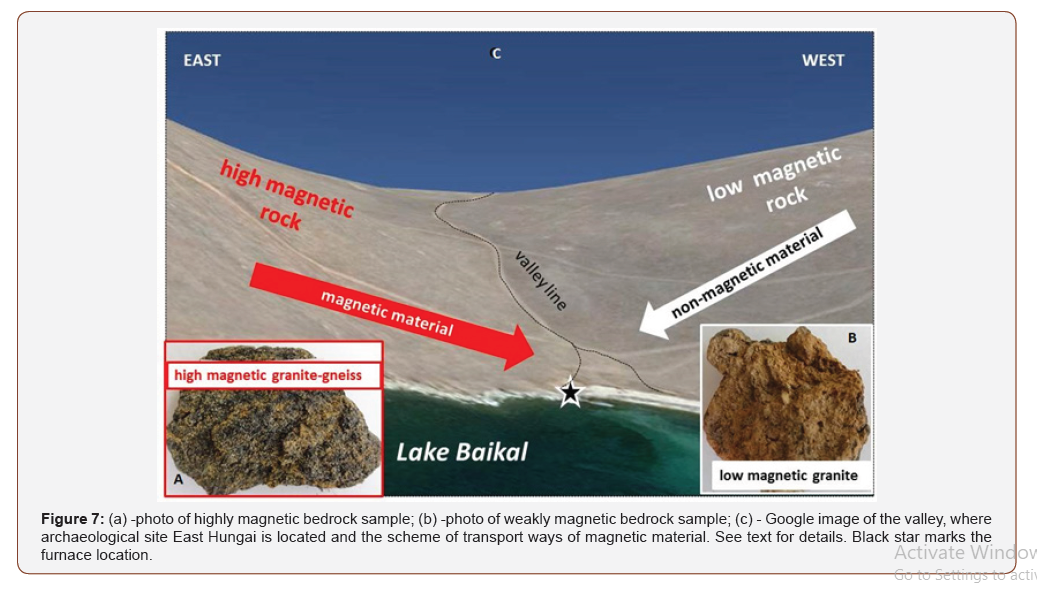
At a depth of 30 cm, the “anthropogenic” (with artifacts) and “natural” (after removing artifacts) maps are generally similar but different in details (Figures 6b & c), while both are quite different from the surface map. First of all, the difference lies in the values of magnetic susceptibility. Its highest values on the “anthropogenic” map are due to slags - highly magnetic products of ancient metallurgy. Most of the slags are found in squares A1 and B1 (Fig. 6c). Besides slags, some bedrock fragments are also exhibit enhanced values of magnetic susceptibility. Such fragments are represented by yellow-gray to dark gray and black granite-gneiss (Figure 7a), biotite-amphibolite gneiss and schistized amphibolite. The rocks were identified during the field campaign by Prof. V.I. Levitsky (Vinogradov Institute of Geochemistry Siberian Branch Russian Academy of Sciences, Irkutsk, Russia).

The next difference between the “natural” and “anthropogenic” maps is one in the anomalies source, which causes the mismatch of the anomalous points with a few exceptions. On the “natural” map, anomaly points indicate mainly “contamination” of the soil by very small fragments of strongly magnetic rocks, probably the product of crushing of large ore pieces (Figure 6b). On the “anthropogenic map”, anomaly points are due to slags, locations of the slags fragments are sporadic and in no way associated with ore fragments (Figure 6c).

The distribution of magnetic susceptibility at a depth of 50 cm differs sufficiently from that in the overlying horizons (Figure 6d), although the difference in the background values for western and eastern parts of the excavation area remains. Instead of the alternation of small-size susceptibility anomalies with different amplitudes (Figure 6b), large-size anomalies have amplitudes of 2.5-3.5×10⁻³ SI. They are located in the eastern part of the excavation area (blue rectangles in Figure 6d) and near the furnace (green rectangles). Significant anomalies from artifacts on this surface were not observed.

Discussion

Values and behavior of rock-magnetic parameters of soils and underlying parent sediments in the squares A1 and A2 are substantially different; these differences are preserved for depth up to 70 cm. The above differences are follows:

I. The concentration of magnetic minerals in the soil and, especially, in the underlying parent layer in square A1 is significantly higher than in square A2;

II. The sizes of magnetic grains as estimated by their domain state are much coarser in the underlying layer of square A2 than in square A1; magnetic grains in soil horizons of the square A2 are finer than in the similar horizons of the square A1.

Given the proximity of the excavation profiles, this fact, as such, requires an explanation, which will help to clarify whether this anomalous phenomenon is natural or artificial, caused by the ancient iron production activity.

The nature of the difference in magnetic susceptibility.

The East Hungai archaeological site is located in the valley, the western and eastern slopes of which exhibit significantly different bedrock magnetic properties The expositions on the east slope are represented by granite-gneiss (Figue 7a) with high (up to 10-1 -10-2 SI) values of magnetic susceptibility, while the bedrocks of west slope are composed by granites and meta-sedimentary rocks (Figure 7b) with magnetic susceptibilities less than 10-5 SI. We suggest that weathering products of the bedrock from both sides of the valley were transporting along the slopes down to Baikal Lake by temporary flows and mixing with the upper soil layer. That resulted in a fairly uniform increase in the magnetic susceptibility of the soil cover on the eastern slope and relative decrease of susceptibility on the western slope (Figure 7). This assumption is strengthened by measurements of the topsoil magnetic susceptibility outside the excavation site: the surface layer on the eastern slope is characterized by enhanced susceptibility values with an average close to that at the archaeological site in squares A1 and B1. The topsoil from the western slope demonstrates low “background” values of magnetic susceptibility. Since the center line of the excavation area, dividing it into squares A1, B1, on the one hand, and A2, B2, on the other, was laid along the valley line, the enhanced magnetic susceptibility of the surface soil layer on the eastern side and lower values on the western side are the result of natural denudation from the surrounding hills (Figure 7).

However, the valley is dry (annual precipitation is here less than 200 mm/year), the elevation of surrounding hills is less than 60 m above the level of Lake Baikal and their slopes are very gentle. It is unlikely that large (up to 10 cm in size) fragments of bedrock could be transported by slope-wash process in such landscape environment. That is why we assume it was due to a process with energy greater than that of the slope wash. This process resulted in eroding highly magnetic bedrock and depositing thick cover of sandy loam and loam with bedrock fragments of different sizes. Such an event could be the impact of the megaflood caused by the tsunami from the co-seismic landsliding that occurred on Lake Baikal 11.8-13.4 thousand years ago [16]. Thus, we conclude that the differentiation in magnetic properties of sediments on the East Hungai site resulted from the interaction of two factors, namely of the initial differentiation of the bedrock material and of the high-energy sedimentary process, which contributed to intensive desintegration of bedrock and to easy transport of the disintegrated products.

The possible iron ore source

The magnetic susceptibility values on the surface layer of the eastern slope are comparable with those in the topsoil the Kurma iron-smelting center on the opposite bank of Baikal Lake [6]; therefore, the concentration of magnetic material in these two iron-smelting sites is approximately the same. Taking into account the neighboring location of those two sites (14 kilometers in a straight line across Lake Baikal) that provide free migration of the population between sites during the winter over the ice, we can assume that the iron technology in the center of Kurma and in the East Hungai site was the same. This means that the ore source for iron production for the both sites was also the same - the loose products of weathering of strong magnetic bedrock slope-washed down the slope (talus).

The nature of susceptibility anomalies at 50 cm depth

Since the fundamental differences in the values of magnetic susceptibility in the eastern (squares A1 and B1) and western (squares A2 and B2) parts of the excavation area are stored at all the three hypsometric levels (0 cm, 30 cm, 50 cm), they have not anthropogenic but a natural cause, which is already discussed above. From the archaeological point of view, the most interesting are the anomalies that appeared only at the depth of 50 cm. Since the furnace in the study area is located at a depth of 40-60 cm from the day surface (Fig. 1), these anomalies can be associated precisely with the process of iron production. It is known that in the immediate vicinity of metallurgical furnaces, under the influence of high temperatures, magnetic the susceptibility of the topsoil increases due to the neoformation of magnetic minerals (mainly magnetite) as a result of burning soil organic matter [9, 10]. Most likely the anomalies inside the green rectangles on Fig. 6d are connected with furnace operation: the anomaly in the eastern rectangle is associated with ore storage before charging into the furnace, while west anomaly with lower intensity may be considered as smithing zone. The most eastern linearly elongated group of anomalies (inside the blue rectangle in Figure 6d) located at some distance from the furnace most likely corresponds to a large zone of preparation of the material for the melting process. At least two such zones are known in ancient iron smelting centers: zone of charcoal production and zone of raw material preparation (washing, roasting and crushing) [10]. Since no charcoal remains were found in this area, and fragments of presumed ore found quite often, we suggest that this area is a raw material preparation zone.

The scale of iron-smelting activity in East Hungai site

The furnace in the East Hungai is the only one in this part of Baikal shore; no other furnaces were found in the vicinity of Hungai Bay. The amount of slag found during excavation is rather small, up to 1 kg in weight, as well as amount of clay pottery fragments (few pieces only). When compared to slag volumes (up to hundreds of kilograms) in the neighboring metallurgical sites of Kurma and Barun-Hal, where iron production has been operating for several centuries [11,12], the small slag amount at East Hungai indicates that only single, probably, trial iron smelting was run here. Indirectly, this assumption also strengthened by very small amount of the pottery finds of ceramics. Apparently, the quality and/or small amount of iron ore in the vicinity of the site were not favorable for a long-lived smelting production here. Thus, as evidenced by the furnace, the ancient metallurgists were exploring and looking for convenient and promising places for organization of a large-scale iron production.

Conclusion

The study of the rock-magnetic properties of the geological environment at the archaeological site “East Hungai” has shown that the magnetic anomalies associated with the ancient metallurgical activity are complicated by the natural geological setting. High concentration of magnetic minerals in the weathering products increases the “background” magnetic susceptibilities of all soil horizons and underlying sediments. The ranges of magnetic susceptibility of the horizons overlap the magnetic susceptibility range of most archaeological finds (except slags), and those objects did not appear on the susceptibility maps at all three hypsometric levels.

The eastern and western parts of the excavated area exhibit different rock-magnetic properties (in terms of concentration and sizes of magnetic grains) due to the interaction of two geological factors, namely, of the initial differentiation of the source (bedrock) material and of the high-energy sedimentary process. These processes contributed to intensive desintegration of bedrock on the east and west sides of the valley and to easy transporting of those disentegrated products. The possible reason of this high-energy sedimentary environment may be co-seismic tsunami in Baikal Lake 11.8-13.4 Kyr ago. Most likely, the disintegrated material from highly magnetic granite-gneiss on the eastern side of the valley served as a raw material for the iron-smelting at the site.

Despite complex magnetic susceptibility distribution on the 50 cm level, it was possible to recognize magnetic susceptibility anomalies presumably associated with the iron production. The group of anomalies in the western part of the excavation area marks the zone of raw material preparation (washing, roasting and crushing), while the near-to-furnace anomalies mark places of ore storage for further charging ore into the furnace and, probably, a smithing work place.

The finding of only a small single furnace and absence of large deposits of high-magnetic iron ore in the nearby area may indicate that ancient metallurgists used prospecting works and trial iron smelting in promising (from their viewpoint) places, which testifies the remarkable activity of ancient metallurgists on the western shore of Lake Baikal.

To read more about this article...Open access Journal of Archaeology & Anthropology

Please follow the URL to access more information about this article

https://irispublishers.com/oajaa/fulltext/ancient-iron-smelting-site-east-hungai-on-olkhon-island-lake-baikal-russia.ID.000534.php

To know more about our Journals...Iris Publishers

To know about Open Access Publishers

Iris Publishers-Open access Journal of Hydrology & Meteorology | Energy Generation Along the Water Supply in Greater Bilbao


Authored by Alegría N*,

Abstract

There is a need of planning the compatible uses for water. The water supply to Bizcay has its origin in the basins of the watersheds of the north (between 25 % and 40 %, depending on the rainfall of the year), and in the basins related to the water transfers from the headwaters of River Zadorra and River Cerneja (between 75 % and 60 %), both tributaries of River Ebro. These two resources count on an energy generation system each. This way the energetic use and the domestic use are brought into line, together with the recreational and regulation uses of the reservoirs of the headwaters.

Keywords:Compatible uses; Hydroelectric energy; Electric generation

Introduction

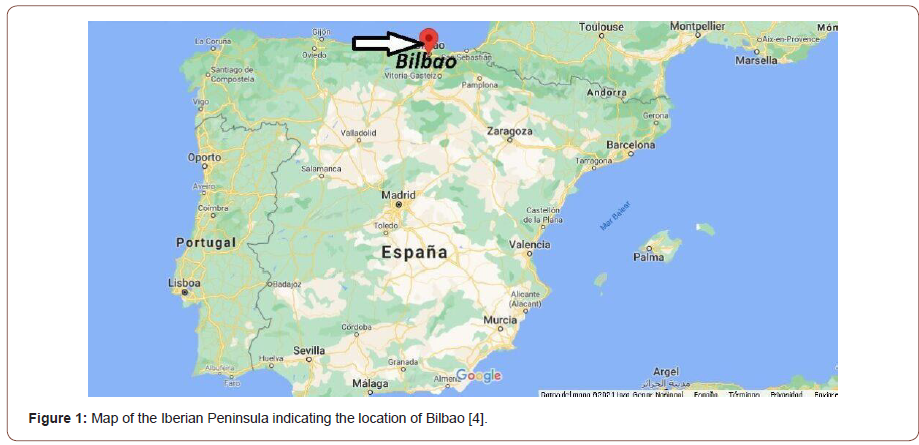
The city of Bilbao is located 15 km upstream from the Cantabrian coast, in the province of Bizcay that belongs to the Community of the Basque Country. As shown in Figure 1, Bilbao is located in the north of the Iberian Peninsula, between mountain and sea.

Due to its orography, the province of Bizcay has the particularity of not having reservoirs that can supply water to the population [1-3]. Therefore, there has never been a chance for accumulating water in large quantities in the province of Bizcay in order to enable the development of its population (Figure 1).

irispublishers-advances-in-hydrology-meteorology

Focusing on Bilbao and its urban area, during the 50s-60s two very important concessions were authorized to carry out two water transfers. This way, the necessary water supply of this area was guaranteed: the water transfer from River Zadorra that provides approximately 70 % of the water needed from the province of Alavaand the rest from the water transfer from River Ordunte located in the province of Burgos [5].

In addition, the reservoirs in the headwaters promote the quality of life of the population of its surroundings by increasing the recreational uses and also by increasing the capacity for flood abatement in the zone in case of intense precipitation. The reservoirs of River Zadorra keep 20 % of their total volume for flood abatement operations, whereas the reservoir of River Ordunte has am emptying system that works by overflow and can be filled up to its whole capacity.

In the last decades, the consciousness-raising of the population has stimulated the compatible uses of water and, as a result, the same water that reaches the homes is previously used to produce hydroelectric energy taking advantage of the elevation differences of the masses of water.

In this particular case, water that comes from the water transfer of River Zadorra runs through 3 turbines in different Hydraulic Power Plants (HPP): the underground Barazar HPP, the dam-toe Undurraga HPP and, finally, Bolueta HPP of that uses surplus water. On the other hand, water that comes from River Ordunte runs through 2 turbines in different HPP-s: the dam-toe Ordunte HPP and Sollano HPP.

Discussion

Barazar HPP

This HPP was designed and built up in the 50s. It was a very complex construction as long as its underground cavern (L 90 m x H 30 m x W 17.5 m) gets into a depth of 200 m.

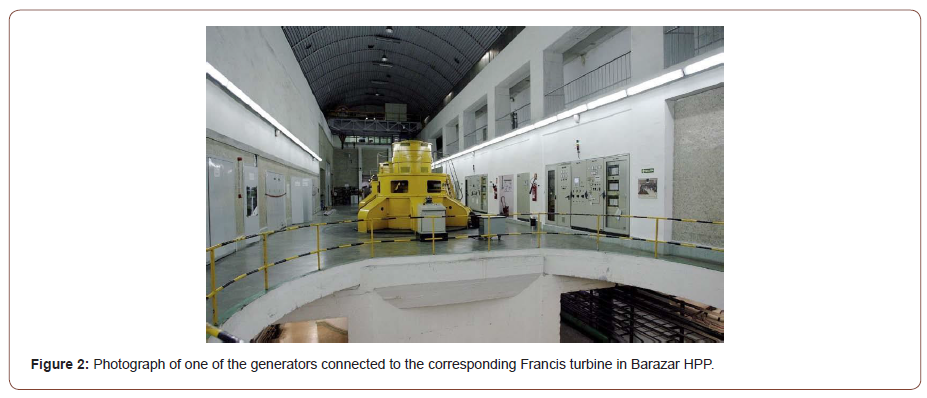
Initially, the installation of 4 Francis turbines was foreseen, but only 2 turbine-generator groups were installed in the end. Each group (see Figure 2) had a Francis turbine of 42160 kW rotating at 500 RPM. Besides, a Pelton turbine coupled to a generator of 1000 kVA was also installed for self-supply.

This HPP belongs to the Company Iberdrola S.A. that manages its operation under the management of the Hydrographic Confederation of River Ebro [5].

The characteristic data of the power plant are a gross head of 328.6 m and a flow rate of 15 m3/s. The Bilbao Bizkaia Water Consortium (CABB) establishes the total volume of water that needs to be transferred daily, so that the total operation hours of the turbines can be defined. The average value of this operation period is close to 4 hours per day (Figure 2).

irispublishers-advances-in-hydrology-meteorology
Undurraga HPP

This HPP is a toe-dam power plant that was designed and built up in the 90s. However, the reservoir where it takes the water from dates from 1959 [6].

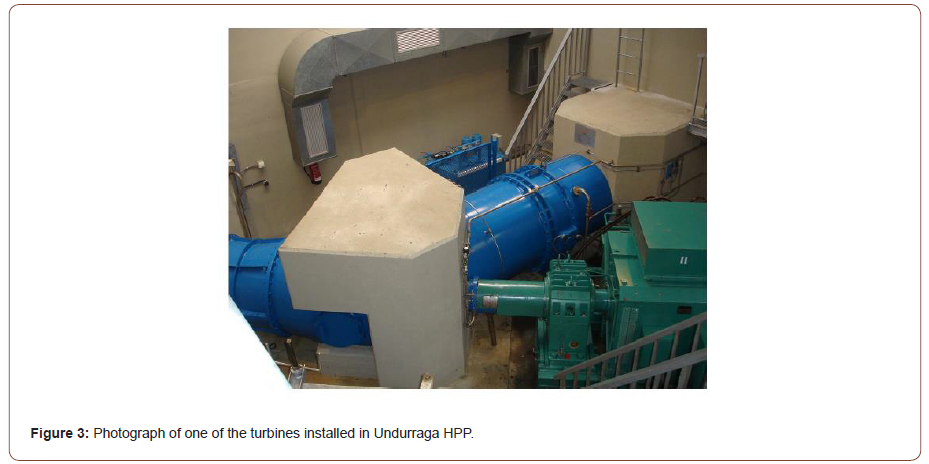
The facility has 2 semi-Kaplan turbines with horizontal shafts as shown in Figure 3. Each turbine provides a nominal power of 1275 (kW).

The characteristic data of the power plant that belongs to the CABB are a net head of approximately 20 m and a flow rate of 2.5 m3/s with a continuous operation for one of the turbines. The other turbine only works when there is a surplus flow rate that takes place only during 60 days in a year in average (Figure 3).

irispublishers-advances-in-hydrology-meteorology
Bolueta HPP

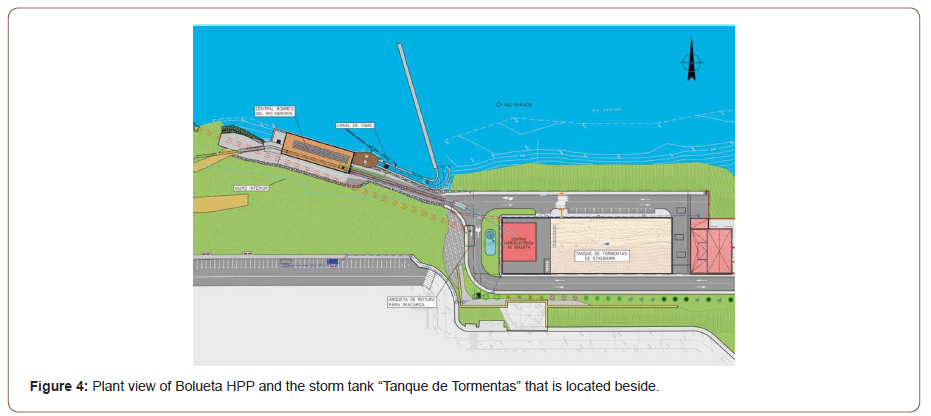
This HPP was built up in 2018 and has 2 Francis turbines with horizontal shaft. It belongs to the CABB and is able to run its turbines up to a flow rate of 4.50 m3/s. It takes advantage of the elevation difference that exists between the water treatment plant of Venta Alta (elevation +173.0 m) and Bolueta HPP where the turbines are installed (elevation +28.1 m) [7].

This HPP will work an average of 42 days during the year. Figure 4 shows the plan view of Bolueta HPP and the storm tank that is located beside (Figure 4).

irispublishers-advances-in-hydrology-meteorology
Ordunte HPP

This HPP was designed and built up in the 50s. It was operated by the Energy Agency of the Basque Government (EVE) in the past. At this moment Bioartigas S.A. is responsible of its operation [8].

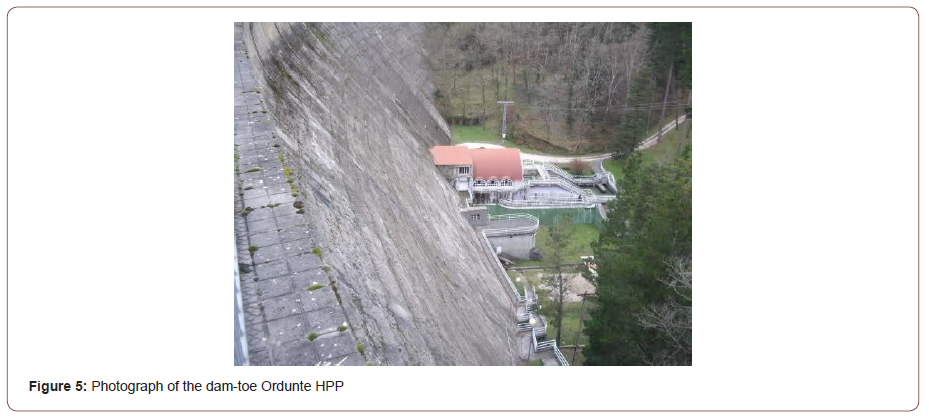
The HPP has a Francis turbine with a horizontal shaft. The characteristic data of the power plant are a maximum gross head of 40 m with a net head of 38.28 m, a flow rate of 1.5 m3/s operating continuously. The nominal power is 535 kW with a rotation speed of 750 RPM. Figure 5 shows the location of the dam-toe power plant (Figure 5).

irispublishers-advances-in-hydrology-meteorology
+Sollano HPP

This HPP was designed and built up in the 60s and belongs to the City Council of Bilbao.

The characteristic data of the power plant are a net head of 93.12 m, a flow rate of 1.2 m3/s operating continuously.

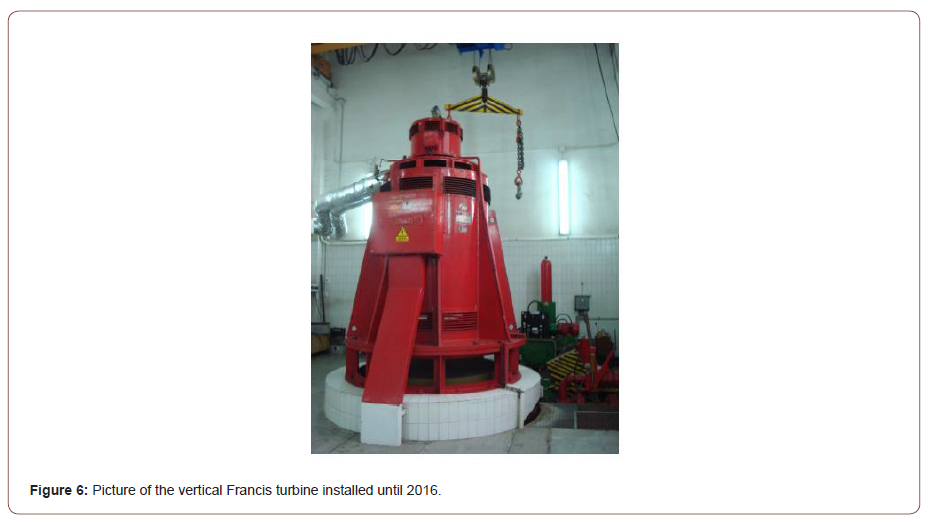
Initially a vertical axis Francis turbine was installed with a power, or 1476 kW coupled to a synchronous generator of 1875 kVA, 1000 RPM, 5000 V and 50 Hz and, in parallel with the network at 30 kV by means of a transformer with a power of 2000 kVA. The old vertical axis Francis turbine is shown in Figure 6. In 2016 it was replaced by a horizontal axis Francis turbine fed by means of a spiral case with wicket gates [9] (Figure 6).

irispublishers-advances-in-hydrology-meteorology

Conclusion

The coordinated exploitation of the water supply with the operation of the aforementioned hydroelectric power plants provides a hydroelectric generation that ranges from 100 GWh to 120 GWh for one year, depending on the pluviometry. This electricity generation helps to meet the increasing electricity demand.

According to the new energetic tendencies of the hydraulic field, the mini hydraulic generation is now being proposed to be incorporated inside the supply networks by means of hydrokinetic turbines. This way, water will run more times through different turbines before being consumed and more energy will be produced.

To read more about this article...Open access Journal of Hydrology & Meteorology

Please follow the URL to access more information about this article

https://irispublishers.com/ahm/fulltext/energy-generation-along-the-water-supply-in-greater-bilbao.ID.000507.php


To know more about our Journals...Iris Publishers

To know about Open Access Publishers

Monday, February 27, 2023

Iris Publishers-Open access Journal of Ophthalmology & Vision Research | Evaluation of Ethambutol Toxic Optic Neuropathy Module as Training Approach for Tuberculosis Directly Observed Treatment Short-course Health Workers in Manila: A Pilot Study


Authored by Ryan Caezar C David*,

Abstract

Aim: To determine the effectiveness of the ethambutol toxic optic neuropathy (ETON) module as a training approach and to increase the competency of primary health workers in assessing the visual health of TB DOTS patients.

Methods: Thirty-six (36) TB DOTS sites in Manila were included in the evaluation and were randomly allocated into 2 groups. Group 1 was assigned as the treatment group, received the ETON module, and Group 2, the control group, was provided with information, education, and communication materials only. A questionnaire on knowledge, attitudes, and practices on vision screening was administered before and after intervention. An objective structured clinical examination (OSCE) was also performed. The ETON module and the evaluation process were facilitated by a group of ophthalmologists.

Results: There was a significant difference in the post-intervention knowledge scores for the treatment group (M=9.27, SD=2.191) and control group (M=7.27, SD=3.121) conditions; t(34)=2.22, p = 0.03. No quantifiable change in attitudes between groups was assessed at the time of intervention. There was a significant difference in the increase in practice scores for the treatment group prior to intervention (M=28.3, SD=12.169) and post-intervention (M=56, SD=10.53) conditions; t (34)=-7.30631, p<0.0000001, and there was also significant difference in the increase in practice scores for the control group prior to intervention (M=22.3, SD=5.45) and post-intervention (M=45.9, SD=17.031) conditions; t (34)=-7.30, p<0.0000001. With regard to the implementation of the OSCE, it can be noted that participants from both groups scored least in obtaining the correct Best Corrected Visual Acuity (BCVA) and scored most in straight-forward types of eye-screening tests such as Ishihara Color Vision Test and Amsler Grid. This research showed that participants under the treatment group performed significantly better than the control group.

Conclusion: The ETON Module can be used to improve the standard of care by extending access to visual health services by building the capacities of primary health workers to be a reliable referral pivot point in monitoring ETON among TB patients. This study can be used as a foundation to initiate an expanded primary health services to improve the visual health outcomes for TB patients.

Keywords:Ethambutol; Optic neuropathy; Tuberculosis

Introduction

Introduction The Philippines is one of the highest tuberculosis burdened countries in the world. Currently, the Philippines is 8th among the twenty-two (22) tuberculosis high-burden countries in the world in terms of tuberculosis cases. In 2015, World Health Organization (WHO) reported tuberculosis has an incidence of 322/100,000 and a mortality rate of 13/100,000 per population in the country [1]. The Department of Health (DOH) also reported that there is a marked decline in tuberculosis burden since the launching of the Directly Observed Treatment Short Course (DOTS) strategy in 1996. Cases and deaths due to tuberculosis were reduced by more than fifty (50) percent from the 1990 baseline [2]. However, it is noted that the program lacks guidelines specifically addressing the identification, record keeping, prevention and management of possible unwanted visual effects of taking anti-tuberculosis medications [3].

Ethambutol has been used to treat tuberculosis since 1960s. The potential for visual impairment was recognized soon after its introduction [4]. The visual loss in ethambutol toxic optic neuropathy is typically relatively symmetrical, with a subacute onset usually commencing 2 to 8 months after initiation of treatment. There is variability at the onset of ethambutol toxic optic neuropathy as reported in a meta-analysis of 70 cases, whereas the shortest duration of therapy prior to onset of symptoms was 3 days and the longest was 18months [5].

According to the WHO Treatment of Tuberculosis Guidelines, the recommended dose of ethambutol for adults as a daily regimen is at 15mg/Kg/day and as a thrice a week regimen at 30mg/Kg/ day [6].Several studies have been reported regarding the incidence of ethambutol toxic optic neuropathy in different countries [7-10]. In the literature, optic neuritis develops in 50% at a dose of 60mg/ Kg/day and can even develop with the standard dosage [11]. In a meta-analysis done by Ezer et al, pooled cumulative incidence of any visual impairment in all patients was 22.5 per 1,000 persons treated with ethambutol, and permanent impairment was 4.3 per 1,000. Typically, vision loss was noted to be reversible once the drug is discontinued early [12]. In reversible cases, resolution of impairment occurred after an average of 3 Months [10]. Despite of this surmounting studies, there is still no available data regarding the incidence of ethambutol toxic optic neuropathy in the Philippines. The screening tests for ethambutol toxic optic neuropathy (ETON) are those that measure the functions of the optic nerve, specifically the papillomacular bundle. Good measurement of the optic nerve function includes visual acuity, color vision test, and central visual fields [13-17]. It has been reported that different color vision errors occur as an early signs of ethambutol toxic optic neuropathy in patient with normal acuity and no other visual symptoms. The Ishihara test is the most commonly used screening tool for color vision abnormalities. It is mainly useful in detecting congenital and acquired red-green deficiency. The more common visual field manifestation in ETON is a central or ceco central scotoma [16,18- 20].

The ETON module is a collaborative project between Ospital ng Maynila Medical Center Department of Ophthalmology, Manila Health Department and Neuro-ophthalmology Society of the Philippines. It is a module based on the recommended practices on identification, prevention and management of ethambutol toxic optic neuropathy by the Philippine Academy of Ophthalmology and Neuro-ophthalmology Society of the Philippines. Its primary function is to increase the knowledge, attitudes, and practices training of TB DOTS health workers on basic eye screening tests as an extension of National Tuberculosis TB Control Program service and strengthen the surveillance of visual disorders related to the administration of anti-tuberculosis medications. A monitoring and evaluation on the ETON module were conducted to assess how the system has helped the proficiency of health workers in rendering basic eye screening services to TB DOTS patients.

Material and Methods

Research design

This study was designed using a randomized control-group pre-test and post-test design. In this design, there is randomization of study subjects to treatment and control groups. In essence, this design allowed the comparison of the relative effectiveness of supportive supervision delivered through ETON module with that of the IEC materials strategy. There were two measurements for each batch of training participants: baseline and immediately after training. This design allowed measurement of the immediate outcome of the training.

Study sample population

Thirty-six TB DOTS health workers were included by convenience sampling. These were randomly allocated into the treatment and control group. The treatment group whose members received the ETON module and supportive supervision by a neuro-ophthalmologist. The comparison group received only IEC materials.

Measuring knowledge, attitudes and practices

The performance areas evaluated include knowledge, attitudes, and practices on ETON and basic eye screening tests including

• Visual acuity testing

• Color vision testing

• Visual field testing

To answer the question on competency retention, a KAP questionnaire used by Dizon et al in 2013 and an objective structured clinical examination (OSCE) based on the topics covered were administered immediately post-training. The components of OSCE were

1. Best Corrected Visual Acuity

2. Ishihara Color Vision Test,

3. Amsler Grid and

4. giving the Final Disposition if ophthalmology service referral is warranted.

Facilitated focus group discussions (FGD) were conducted postintervention to assess how the ETON screening module affected the health service providers’ attitude and behavior towards skill performance.

Statistical analysis

Data based on results of the performance review was encoded and analyzed using the statistical software, IBM SPSS Statistics Subscription. Descriptive analyses included the calculation of the mean, median and mode of continuous variables while qualitative variables are presented as frequency distributions. KAP and OSCE mean scores before and after intervention for both groups were compared using the Student’s t-test.

Result

A total of thirty-six participants were included in the study and were randomly allocated into two groups. The groups had a similar number of representation of 18 participants per group. For those who were enrolled in the treatment group, the average age was 38.3 years, while in the control group, it was 42.1 years. TB DOTS nurses were generally female, about 77% of all the participants. It can be noted that baseline characteristics (i.e. age, sex, average number of years of TB DOTS practice, and average number of TB DOTS seminars attended) are similar between groups. Demographic data are reported in (Table 1).

Table 1: Baseline Characteristics of Local TB DOTS Nurses Enrolled in the ETON Module Program Evaluation.

irispublishers-openaccess-ophthalmology-vision-research

Knowledge, attitudes, practices

Results measuring knowledge, attitudes, and practices are shown in Table 2. There was no significant difference in the knowledge scores prior to intervention for the treatment group (M=5.22, SD=3.61) and control group (M=4.11, SD=2.74) conditions; t (34) =1.039, p = 0.3061. Another independent-samples t-test was conducted to compare mean scores of the treatment group and of the control group after administering the respective interventions. There was a significant difference in the knowledge scores after ETON module implementation for the treatment group (M=9.27, SD=2.191) and control group (M=7.27, SD=3.121) conditions; t (34) =2.22, p = 0.03 (Table 2).

Table 2: Mean Knowledge, Attitudes, and Practices Scores of Participants from Treatment and Control Groups Before and after Intervention.

irispublishers-openaccess-ophthalmology-vision-research

Attitudes were described through a Likert type of scoring system using a 3-Item Questionnaire. Attitudes were analyzed as scores, a continuous variable. There was no significant difference in the decrease in attitude scores for the treatment group prior to intervention (M=13.9, SD=2.15) and post-intervention (M=13.2, SD=1.83) conditions; t (34) =1.05188, p= 0.3. Another t-test was performed to know if the change in the mean scores of the control group post-intervention was significant. There was no significant difference in the increase in attitude scores of the control group prior to intervention (M=13, SD=2) and post-intervention (M=14, SD=1) conditions; t (34) = p = 0.03.

Practices assumed by the treatment group prior to the ETON Module were described using a 12-Item Questionnaire. Results show an increase in the percentages that represents practices after undergoing the ETON Module. Practices were analyzed as scores, a continuous variable. There was a significant difference in the increase in practice scores for the treatment group prior to intervention (M=28.3, SD=12.169) and post-intervention (M=56, SD=10.538) conditions; t (34) =-7.30631, p<0.0000001. Another t-test was performed to know if the change in the mean scores of the control group post-intervention was significant. There was a significant difference in the increase in practice scores for the control group prior to intervention (M=22.3, SD=5.4545 and post-intervention (M=45.94444, SD=17.031) conditions; t (34) =-7.30631, p<0.0000001.

Objective structured clinical examination

An OSCE on Eye Screening Tests was done to test both groups’ retention on the expected skills they have learned from the ETON Module and the IEC materials. Table 3 shows the performance scores under the following parameters:

• Best Corrected Visual Acuity

• Ishihara Color Vision Test

• Amsler Grid and giving the

• Final Disposition

(Table 3)

Table 3: Mean OSCE Scores of Participants from Treatment and Control Groups after Intervention.

irispublishers-openaccess-ophthalmology-vision-research

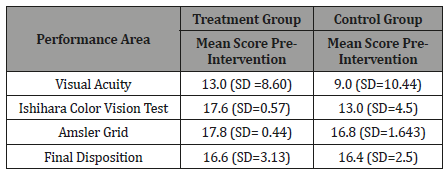
The difference in mean scores in visual acuity testing between the treatment group (M=13, SD=8.60) and the control group (M=9, SD=10.44) is not statistically significant (t=1.25466, p=0.4323), although a difference of about 30% can be appreciated. The difference in mean scores in Ishihara plate color vision testing between the treatment group (M=17.6, SD=0.57) and the control group (M=13, SD=4.5) is also statistically significant (t=4.30254, p<0.00001) The difference in mean scores in Amsler Grid testing between the treatment group (M=17.8, SD=0.44) and the control group (M=16.8, SD=1.643) is statistically significant (t=2.48, p<0.005). In giving the final disposition whether an ophthalmology service referral is warranted or not, given the clinical circumstances of the cases, the difference in mean scores in giving the final disposition between the treatment group (M=16.6, SD=3.13) and the control group (M=16.4, SD=2.5) is not statistically significant (t=0.2118, p=0.3632).

Discussion

Evidence suggests that most of the anti-tuberculosis medications can cause toxic optic neuropathy, ethambutol being the most notorious of this adverse effect. Despite sufficient evidence on ETON, our health program on tuberculosis control lack provisions in preventing this dreaded adverse effect. It should be emphasized that ethambutol toxic optic neuropathy is a reversible disease. A delayed recognition of this disease could mean bilateral irreversible blindness to affected patients. Simple eye screening tests like visual acuity testing, color vision testing or central visual field testing may be adequate to make a difference in affected patients. Preintervention poor knowledge scores suggest that although the participants are trained TB DOTS staff with adequate seminars attended, ETON as an essential part of TB DOTS health service was not discussed adequately. The participants were amenable toward visual health screening for the TB DOTS patient. The health workers acknowledge that there is a need for the eye screening prior and upon anti- tuberculosis treatment. Practices confirmed that the recommended clinical practice guideline on visual health monitoring among TB patients is not being implemented. The effectivity of the interventions are confirmed by the increase in knowledge and practices both from the ETON module and IEC only groups. Attitudes remained high post intervention. Although both groups improved, it should be noted that the ETON module group significantly increased in proficiency compared to IEC only group.

With regard to the implementation of the OSCE, it can be noted that participants from both groups scored least in obtaining the correct Best Corrected Visual Acuity (BCVA) and scored most in straight-forward types of eye-screening tests such as Ishihara Color Vision Test and Amsler Grid. It was noted that although both groups scored least in obtaining the BCVA, the treatment group scored relatively higher than the control group. The reason for this may be due to the fact that assessing the visual acuity of a patient requires repetition and supportive guidance from an ophthalmologist. Despite not being able to obtain the correct BCVA of the patient, with the guidance of two other tests namely the Ishihara Color Vision Test and the Amsler Grid, most of the participants from both groups were able to reach the proper final disposition. A positive result from at least one of the 3 screening tests would be sufficient to reach a final disposition to refer a patient for further evaluation and management of ETON, hence a high score for the category of final disposition. Although, it should not be underscored that a better accuracy in performing the tests are valuable in detecting subtle changes in optic nerve functions, thus enabling early recognition of a possible toxic optic neuropathy.

With regard to the acceptability of the program to the participants, the participants provided a generally positive rating to both the program content and facilitators. During the feedback session, they requested a follow-up training with a longer program time and less compressed topics in at least one training day.

Limitations

Although a small sample was used to conduct this pilot study, participants were from the city of Manila which allowed an adequate sample of health workers in TB DOTS centers. The findings of this study confirm that there is no visual health program implemented in our TB DOTS centers. The questionnaire for the practices post intervention were made in a futuristic manner, hence, the results can be an overestimation of what would have been done in the real clinical setting. No pre-intervention OSCE was done, hence, a pretest and post-test comparison for OSCE is not part of this study. Another limitation includes the limited time for the participants to learn the ETON module. Due to a limited permitted time to have the participants, the ETON module and OSCE was done in a span of half day. Probably a longer time to teach the module will provide better retention and outcome.

Conclusion

This study determined the effectiveness and practical use of the ETON Module in increasing the competency of health workers in providing basic eye screening tests to TB DOTS patients. The ETON Module can be used to improve the standard of care by extending access to visual health services by training our primary health workers to be a reliable referral pivot point in monitoring ETON among TB patients. This study can be used as a foundation to initiate an expanded primary health services to improve the visual health outcomes for TB patients.

To know about Open Access Publishers

Iris Publishers-Open access Journal of Hydrology & Meteorology | Influence of Community Resilience to Flood Risk and Coping Strategies in Bayelsa State, Southern Nigeria

  Authored by  Nwankwoala HO *, Abstract This study is aimed at assessing the influence of community resilience to flood risk and coping str...