Thursday, March 28, 2024

Iris Publishers- Open access Journal of Agriculture and Soil Science | Effects of Seed Rate and Nitrogen Fertilizer Rate on Growth and Biomass Yield of Oat (Avena Sativa L.)


Authored by Yidersal Erega*,

Abstract

The present study was conducted to assess seed rate (SR) and nitrogen rate (NR) effects on biomass yield and nutritional quality of oat (Avena sativa L.) at Sirinka, North Eastern Amhara, Ethiopia on July 2018. Levels of SR were 60, 80 and 100 kg/h and that of NL were 50, 100 and 150 kg/ha in the form of Urea (46% N). The experiment was conducted in a 3x3 factorial arrangement of treatments in a Randomized Complete Block Design (RCBD) with 3 replications giving a total of 27 plots, each measuring 2×1.4 m2. Growth and yield parameters were analyzed. Results showed that the interaction between seed rate and nitrogen rate had a significant (p<0.05) effect on almost all parameters measured except tiller number per plant (TNP). Green forage yield and dry matter yield increased with increasing level of seed rate and level of nitrogen. Generally, combination of 100 kg/ ha seed rate and 150 kg/ha nitrogen recorded higher forage yield. Thus, seed rate of 100 kg/ha and nitrogen fertilizer rate of 150 kg/ha Urea can be recommended for use by farmers in Sirinka area and other areas having similar agro-ecologies and soil type.

Keywords: Biomass yield; Nitrogen rate; Nutritive value; Oat; Seed rate

Introduction

Ethiopia is believed to have the largest livestock population in Africa [1]. Livestock sector has been contributing considerable portion to the economy of the country, and still promising to rally round the economic development of the country [2]. It is eminent that livestock products and by-products in the form of meat, milk, honey, eggs, cheese, butter and provide the needed animal protein that contribute to the improvement of the nutritional status of the people, as well supporting and sustaining the livelihoods of an estimated 80% of the rural population [1,2]. Livestock is an integral part of the farming systems and source of many social and economic values such as food, draught power, fuel, cash income, security and investment in both the highlands and the lowlands/pastoral farming systems [3,4]. The contribution of livestock to the national economy is estimated to be 30% of the agricultural GDP and 19% of the export earnings [2,3]. In spite of the immense contribution of the livestock sector to the national economy, animal productivity is extremely low mainly due to poor standard of feeding both in terms of quality and quantity as the production performance of an animal often reflects its nutritional status [4].

In most tropical countries, inadequate supply of feed is the bottleneck to livestock production [2]. This is due to the dependence of livestock on naturally available feed resources and little development of forage crops for feeding animals [5]. Like in other tropical countries, in Ethiopia, most of the areas in the highlands of the country are nowadays put under cultivation of cash and food crops which resulted in keeping large number of livestock on limited grazing areas leading to overgrazing and poor productivity of livestock [4]. Though, expansion in the cultivation of cereal crops increased the supply of crop residues for animal feeding but, crop residues have low nutritive value and could not support reasonable animal productivity [5]. Hence, shortage of nutrients for livestock is increasingly becoming serious issue in Ethiopia. One of the alternatives to improve livestock feeding, and thereby enhance productivity of livestock is through the cultivation of improved forages and offer them to animals during critical periods in their production cycle and when other sources of feeds are in short supply [2]. The use of cultivated forage crops has received considerable attention for complementing the conventional feed resources especially in areas where feed shortage is the main constraint for livestock productivity [2,5]. From the forage crops, due to short life cycle, suitability in crop rotations and better performance on marginal lands, oat (Avena sativa L.) is an important species for integration into the existing farming system [6]. Oats can be easily cultivated, develops rapidly, and yields high amounts of dry matter and green forage of higher quality when managed properly. Oats are forage crop grown at medium to high altitudes (1600-3000m) on heavy soils (vertisols) where temperate grasses and other improved forages are difficult to establish [2]. The species owes its reputation to its versatility as it can be grown for grain, hay, silage or direct grazing and is being used as feed for dairy cattle, young stock, sheep and goats [7]. Moreover, it has superior recovery after grazing and is highly useful for overcoming critical periods of feed shortage or for finishing animals for market when permanent pastures are of poor quality [8].

With other factors, seed rate, and level of nitrogen fertilizer are key factors, which contribute to the yield and quality of oat [8]. These conditions vary greatly across the agro-ecological areas [5]. Higher fodder yield with fertilizer application is due to their favorable effects on plant water relations, light absorption, crop density, plant height, leaf area and nutrient utilizations [9]. The applications of nitrogen fertilizer improve the dry matter, biomass yield and quality of forage [5]. Hence, there is a need to determine an appropriate level of fertilizer application especially in soils deficient in nitrogen and proper seeding rate to positively affect oat production both in terms of yield and quality. Therefore, to utilize oat as a potential fodder crop in the study area, appropriate seeding rate and level of nitrogen fertilization needs to be determined. Such information appears to be lacking in the study area, and such information are location specific based on the soil fertility status of an area. Hence, this experiment was conducted with the following objectives:

Objective

• To investigate the effect of seed rate and nitrogen rate on growth and biomass yield of oat (Avena sativa L.) at Sirinka, North Eastern Amhara, Ethiopia.

Materials and Methods

Description of the study area

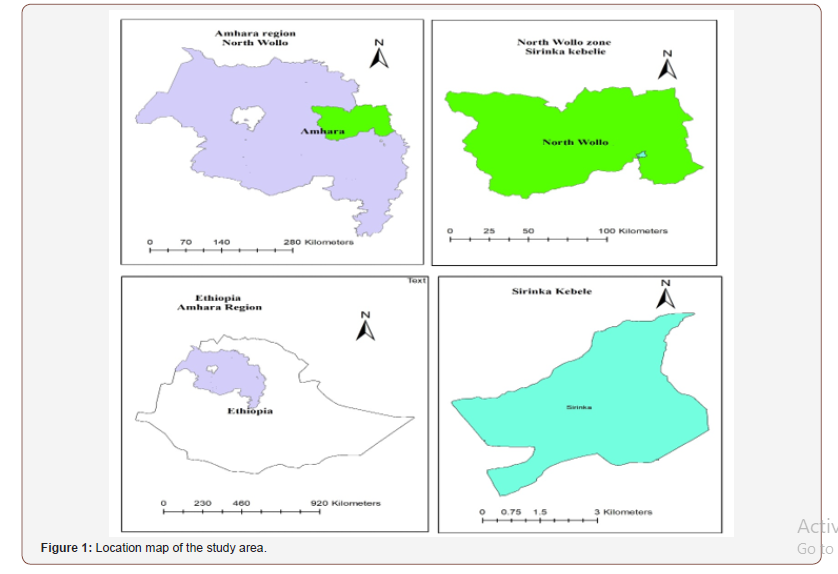
The study was conducted at Sirinka Agricultural Research Center (SARC), which is located 508 km North of Addis Ababa, the capital of Ethiopia (Figure 1). The site is located at an altitude of 1850 meters above sea level and at 110°451’0011” North latitude and 390°361’3611” East longitude [10]. The rainfall pattern is bimodal, with two-rainfall seasons, ‘belg’ (February/March - April) and ‘Meher’ (July-September) with a mean annual rainfall of 950mm. The mean daily temperature range is of 16-21 °C [11]. The soil type of the experimental fields is clay loam, with a pH of 6.98. The soil, organic carbon is 1.35%, total N was 0.07%, available P 13.7 mg kg-1 [1,12].
irispublishers-openaccess-agriculture-soil-science
Experimental materials

The materials used in this experiment was Lampton oat variety, which was recommended by Sirinka Agricultural Research Center as a suitable variety for North Eastern Amhara locality. Nitrogen fertilizer was used as other experimental material in the form of fertilizer grade Urea (46% nitrogen).

Experimental design, treatments and procedures

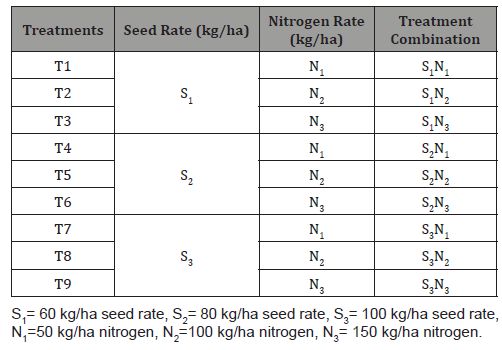
The study was a 3 x 3 factorial arrangement of treatments in a randomized complete block design (RCBD). The two factors were seed rate with three levels (60, 80 and 100 kg/ha) and nitrogen fertilization with three levels (50, 100 and 150 kg/ha) (Table 1). The seed rate and nitrogen fertilization rates were the recommendations set by Sirinka Agricultural Research Center for the oat variety. The gross size of the experimental plot was 2m x 1.4m length and width respectively, accommodating 7 rows of oats at a spacing of 20 cm between rows. Space of net sampling plot size was 1.8m x 1m length and width respectively, in which the two outer most rows and 0.1 m length at both ends considered as border leaving. Five middle rows were used as sampling rows.

Table 1: Treatment combinations used in the experiment.
irispublishers-openaccess-agriculture-soil-science

Land was prepared using tractor drawn cultivator once and bullock twice. The smoothened land was laid out according to the experimental plan. The oat was planted at middle of July 2018 cropping season with 20 cm between rows with three levels of seed rate. The forage was supplied with three levels of nitrogen, in the form of urea. Nitrogen was applied as per treatment specifications. Half dose of the nitrogen was applied at the time of sowing in band in small furrows opened manually adjacent to the seed line and covered with soil to avoid the losses and the remaining 50 percent nitrogen was applied at tillering stage. Full dose of NPS fertilizer (121 kg/ha) was applied at sowing time for all of the plots as a common treatment. All other necessary field management practices were carried out equally for all experimental units.

Data collection
Growth parameters

a. Plant height (cm): The height of ten main shoots from sampling units were measured in cm and averaged. The height measurement was taken from ground level to the base of the fully opened youngest leaf before heading and to the tip of panicle after heading.

b. Number of tillers (per m row length): Total number of shoots (tillers) from demarcated one-meter row length were counted and expressed as average shoot number per meter row length.

c. Number of tillers per plant: Total number of shoots (tillers) from demarcated ten sampling units were counted and expressed as average tiller number per plant from net plot area.

d. Fresh weight per tiller: The total fresh weight of demarcated ten sampling units were divided by respective tiller numbers to record fresh weight per tiller in grams.

Yield parameters

a. Biomass yield (t/ha): The green fodder from the net plot area were harvested leaving 10 cm from the ground level at 50% flowering/heading stage. After harvesting, the produce was weighed in kg from individual plots and was converted and expressed as green forage yield (GFY) in tons per hectare (t/ha).

b. Dry matter yield (t/ha): The dry matter yield (DMY) was determined after dying the fresh samples in an oven at 70 0C for 48 hours. The plot-wise green forage yield was multiplied by respective dry matter percentage to get dry weight in kg per plot and was expressed in t/ha.

Data analysis

The collected data was subjected to the analysis of variance (ANOVA) using the SAS computer package version 9.1 [13]. Mean separation was carried out using least significance difference (LSD). The model for data analysis consists the effects of seeding rate, nitrogen fertilization rate and their interaction. When interaction was significant (P<0.05) simple effect means were compared, otherwise main effect means were compared.

The statistical model used was: Yijk = μ + Si + Nj + Bk + SNij + εijkl;

Where,

Yijk = measurable variable,

μ = overall mean,

Si = the ith seeding rate effect,

Nj= the jth nitrogen fertilization rate effect,

Bk = kth Block effect,

SNij = interaction of seed rate and nitrogen fertilization rate and

εijkl = random error term.

Results

Plant height and tiller number per plant

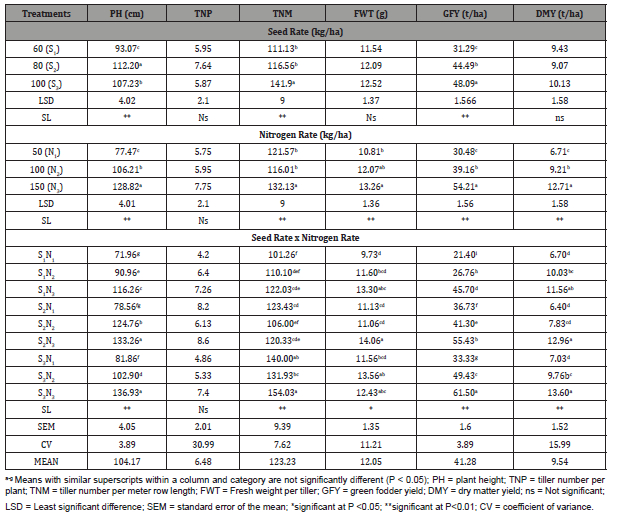
Plant height was significantly affected (p<0.001) by the interaction of seed rate and nitrogen rate (Table 2). The application of 100 kg/ha seed rate with 150 kg/ha nitrogen and 80 kg/ha seed rate with 150 kg/ha nitrogen resulted to significantly higher plant height as compared to other combination of treatments. This was followed by the treatment containing 80 kg/ha seed rate with 100 kg/ha nitrogen, and the lowest plant height was recoded for 60 kg/ha seed rate with 50 kg/ha nitrogen treatment. Although there was significant interaction between seed rate and nitrogen rate on plant height, the trend of response to nitrogen fertilization was consistent as each level of seed rate and vice versa. Plant height was highest for 100 kg/ha seed rate followed by 80 kg/ha and was lowest for the 60 kg/ha seed rate (p<0.01). There was no significant effect of seed rates, nitrogen fertilization rate and their interaction on number of tillers per plant (Table 2). Average number of tillers per plant were 7.64, 5.95 and 5.87 for 80, 60 and 100 kg/ha seed rates, respectively. The number of tillers per plant were 7.75, 5.95 and 5.75 for 150, 100 and 50 kg/ha, respectively.

Table 2: Growth and yield parameters of oat as affected by seed rate and different levels of nitrogen.
irispublishers-openaccess-agriculture-soil-science
Tillers number per meter row length

Number of tillers per meter row length was significantly affected (p<0.01) by seed rate, nitrogen rate and interaction of seed rate and nitrogen rate (Table 2). Interaction effect of seed rate and nitrogen effect was also significant (p<0.001) for this parameter with seed rate of 100 kg/ha seed rate with 150 kg/ha nitrogen recorded higher tillers per meter row length. Number of tillers per meter row length appears to increase with increase in seed rate. The seed rate of 100 kg/ha recorded significantly a greater number of tillers per meter row length (p<0.01) as compared to the other seed rates, while values for the 60 and 80 kg/ha seed rates were similar.

Fresh weight per tiller

The interaction effect of seed rate and nitrogen rate on fresh weight per tiller was significance (p<0.05) and statistically the maximum fresh weight per tiller was recorded in 80 kg/ha seed rate and 150 kg/ha nitrogen rate, and in 100 kg/ha seed rate and 150 kg/ha nitrogen rate. The minimum fresh weight per tiller was recorded in 60 kg/h seed rate and 50 kg/h nitrogen fertilizer. The increase in fresh weight per tiller in the treatments was probably due to higher number of leaves per plant, plant height and leaf area per plant associated with the particular treatment combinations of seed rate and nitrogen rate. Seed rates has no significant effects on fresh weight per tiller and was 12.52, 12.09 and 11.54 g for 100, 80 and 60 kg/ha seed rate, respectively.

Green forage yield

The nitrogen × seed rate interaction for forage green yield was significant (p<0.01) (Table 2). The treatment combination with the highest level of seed rate and nitrogen resulted to the highest green forage yield. This was followed by 80 kg/ha seed rate and 150 kg/ ha nitrogen rate. Conversely, the lowest value of green forage yield was noted for 60 kg/ha seed rate and 50 kg/ha nitrogen rate. Green forage yield of oat increased with increase in seed rate from 60 to 100 kg/ha (p<0.001). Green forage yield of oat also increased significantly (p<0.001) with increase in nitrogen rate from 50 to 150 kg/ha

Dry matter yield

Dry matter yield of oat differed significantly (p<0.001) due to levels of nitrogen and their interaction with seed rate but seed rate has no significant effect on dry matter yield of oats (Table 2). The treatment combination 100 kg ha-1 seed rate at 150 kg ha-1 nitrogen recorded significantly higher total dry matter yield (13.60 t ha-1) followed by 80 kg ha-1 seed rate at 150 kg ha-1 nitrogen (12.96 t ha-1) which was statistically the same with the previous treatment combinations. However, the significantly lowest dry matter yield was recorded with 60 kg ha-1 seed rate at 50 kg ha-1 nitrogen (6.70 t ha-1) which were par with dry matter yields 6.40 t ha-1 and 7.83 t ha-1 recorded at treatment combinations S2N1 i.e. 80 kg ha-1 seed rate at 50 kg ha-1 nitrogen and S2N2 i.e. 80 kg ha-1 seed rate at 100 kg ha-1 nitrogen, respectively.

Discussion

Plant height

Plant height was significantly affected (p<0.001) by the interaction of seed rate and nitrogen rate (Table 2). The application of 100 kg/ha seed rate with 150 kg/ha nitrogen and 80 kg/ha seed rate with 150 kg/ha nitrogen resulted to significantly higher plant height as compared to other combination of treatments. This was followed by the treatment containing 80 kg/ha seed rate with 100 kg/ha nitrogen, and the lowest plant height was recoded for 60 kg/ha seed rate with 50 kg/ha nitrogen treatment. Although there was significant interaction between seed rate and nitrogen rate on plant height, the trend of response to nitrogen fertilization was consistent as each level of seed rate and vice versa. Plant height was highest for 100 kg/ha seed rate followed by 80 kg/ha and was lowest for the 60 kg/ha seed rate (p<0.01). This increase in plant height with seed rate may be due to the fact that dense plants compete for light and nutrients that negatively impact the growth rate. Similarly, Sadig et al. [14]; Dawit & Teklu [5] indicated that plant height increased with increasing seeding rate. However, the current result disagrees with the result of Ayub et al. [15] and Iqbal et al. [16], who reports that plant height of fodder maize was not significantly affected by seed rate. The nitrogen rates influenced plant height significantly (p<0.001) and plant height increased with increase in nitrogen rates (Table 2). Plant height was most responsive to nitrogen application and each successive increase in nitrogen dose significantly produced taller plants. These finding is in line with the results of Zada et al. [17] and Iqbal et al. [16] who reported that plant height increases with the increase in nitrogen doses. Increase in plant height of oat with nitrogen application has also been reported by Sharar et al. [18] and Ayub et al. [15].

Tiller number per plant

There was no significant effect of seed rates, nitrogen fertilization rate and their interaction on number of tillers per plant (Table 2). Average number of tillers per plant were 7.64, 5.95 and 5.87 for 80, 60 and 100 kg/ha seed rates, respectively. The result was in agreement with the work of Murtada [19] who reported that seeding rates had no significant effect on number of tillers per plant. The number of tillers per plant were 7.75, 5.95 and 5.75 for 150, 100 and 50 kg/ha, respectively. Plant population and number of tillers is always a function of germination percentage. The nonsignificant effect of nitrogen on number of tillers may be attributed to the fact that nitrogen might have no effect on germination, therefore plant density under different level of nitrogen can be stable. Similarly, Murtada [19] and Johnston et al. [20] reported that nitrogen rates did not affect number of tillers per plant of maize. But the results of Iqbal et al. [16], who noted increase in nitrogen rates increased the number of tillers per plant in oats disagrees with the current finding.

Number of tillers per meter row length

Number of tillers per meter row length was significantly affected (p<0.01) by seed rate, nitrogen rate and interaction of seed rate and nitrogen rate (Table 2). Interaction effect of seed rate and nitrogen effect was also significant (p<0.001) for this parameter with seed rate of 100 kg/ha seed rate with 150 kg/ha nitrogen recorded higher tillers per meter row length. Number of tillers per meter row length appears to increase with increase in seed rate. The seed rate of 100 kg/ha recorded significantly a greater number of tillers per meter row length (p<0.01) as compared to the other seed rates, while values for the 60 and 80 kg/ha seed rates were similar. High tillers per meter row length with the highest seed rate may be due to plant density produced at higher seed rate. The result was in agreement with the finding of Jayanthi et al. [21] and Aravind [9] who reported that seed rate of 125 kg/ha recorded significantly a greater number of tillers per meter row length of oat than lower levels of seed rates. Nitrogen rate significantly (p<0.001) influenced the number of tillers per meter row length (Table 2). Nitrogen rate of 150 kg per ha recorded significantly higher number of tillers per meter row length than other nitrogen rates, while values for the 100 and 50 kg/ha nitrogen rates were similar (p>0.05). Similarly, Jayanthi et al. [21], revealed that the application of organic and inorganic nitrogen fertilizers recorded higher number of tillers per meter row length in oat.

Fresh weight per tiller

The interaction effect of seed rate and nitrogen rate on fresh weight per tiller was significance (p<0.05) and statistically the maximum fresh weight per tiller was recorded in 80 kg/ha seed rate and 150 kg/ha nitrogen rate, and in 100 kg/ha seed rate and 150 kg/ha nitrogen rate. The minimum fresh weight per tiller was recorded in 60 kg/h seed rate and 50 kg/h nitrogen fertilizer. The increase in fresh weight per tiller in the treatments was probably due to higher number of leaves per plant, plant height and leaf area per plant associated with the particular treatment combinations of seed rate and nitrogen rate. Seed rates has no significant effects on fresh weight per tiller and was 12.52, 12.09 and 11.54 g for 100, 80 and 60 kg/ha seed rate, respectively. These results were in contrast with the findings of Oad et al. [22] who found that fresh weight per tiller of oat was affected significantly by using varying rates of seed. Fresh weight per tiller was affected significantly (p<0.001) by the application of different levels of nitrogen fertilizers. Fresh weight per tiller was higher for 150 kg/ha than 50 kg/ha nitrogen rate, while the value for 100 kg/ha was similar with the other two nitrogen rates. The trend in increased the fresh weight per tiller with increasing nitrogen rate may be attributed to the fact that nitrogen increase plant growth and consequently heavier tillers. This result is in line with that reported by Gasim [23] and Johnston et al. [20] who noted that increasing the level of nitrogen increased fresh weight per tiller oat. Significant variations among oat varieties due to nitrogen rate differences for fresh weight per tiller have also been reported by Arif et al. [24] and Naeem et al. [25]. The increase in fresh weight per tiller in the treatments was probably due to higher number of leaves per plant, plant height and leaf area per plant associated with the particular treatment combinations of seed rate and nitrogen rate.

Green fodder yield

The nitrogen × seed rate interaction for forage fresh yield was significant (p<0.01) (Table 2). The treatment combination with the highest level of seed rate and nitrogen resulted to the highest fresh forage yield. This was followed by 80 kg/ha seed rate and 150 kg/ ha nitrogen rate. Conversely, the lowest value of green forage yield was noted for 60 kg/ha seed rate and 50 kg/ha nitrogen rate. Green forage yield of oat increased with increase in seed rate from 60 to 100 kg/ha (p<0.001). This may be due to the fact that high seed rate resulted in high plant density. This result indicated a close relationship between forage yield and seed rate or plant density. Similar results on oat were reported by Yilmaz et al. [26], Iqbal et al. [16] and Budakli et al. [27]. Green forage yield of oat also increased significantly (p<0.001) with increase in nitrogen rate from 50 to 150 kg/ha. Application of nitrogen fertilizer, therefore, provided better nutrient to oat which resulted in higher fodder yield. Increase in fodder production with the application of nitrogen may be due to the better growth of plants as expressed in terms of plant height, number of tillers, fresh and dry weight of fodder, which was favorably affected by nitrogen fertilizer. Similarly, the increasing trend of green forage yield of oat in response to increasing level of nitrogen fertilizer was observed by many other workers [5,28]. The beneficial effect of nitrogen on forage yield of oat has also been reported by Thakuria & Gagoi [29] and Sheoran et al. [30]. But Iqbal et al. [16] and Sadig et al. [14] noted that further increase in nitrogen (158 kg/ha) showed a negative effect on fodder yield of oat, but also increased economics of fertilizer. This might be due to the fact that excessive fertilization caused lodging, which could reduce biomass yield.

Dry matter yield

Dry matter yield of oat differed significantly (p<0.001) due to levels of nitrogen and their interaction with seed rate but seed rate has no significant effect on dry matter yield of oats (Table 2). The treatment combination 100 kg ha-1 seed rate at 150 kg ha-1 nitrogen recorded significantly higher total dry matter yield (13.60 t ha-1) followed by 80 kg ha-1 seed rate at 150 kg ha-1 nitrogen (12.96 t ha-1) which was statistically the same with the previous treatment combinations. However, the significantly lowest dry matter yield was recorded with 60 kg ha-1 seed rate at 50 kg ha-1 nitrogen (6.70 t ha-1) which were par with dry matter yields 6.40 t ha-1 and 7.83 t ha-1 recorded at treatment combinations S2N1 i.e. 80 kg ha-1 seed rate at 50 kg ha-1 nitrogen and S2N2 i.e. 80 kg ha-1 seed rate at 100 kg ha-1 nitrogen, respectively. Contrary to the current result, Iqbal et al. [16] reported that dry matter yield of maize was affected significantly by different seed rates. This disagreement may be due to differences in seeding rates used, since seed rates used by other scholars had higher variation than the current study. Total dry matter yield of oat increased significantly with increase in nitrogen rate from 50 to 150 kg/ha. These fertilizers promote vigorous plant growth and a larger leaf area that contribute to the dry matter yield of the fodder oat. Iqbal et al. [16] and Dawit & Teklu [5] reported the same result, DM yield of fodder oat increased with increasing level of fertilizer [31].

Conclusion

From this result it can be concluded that:

• High seed rate had more plant population and consequently increased tiller number per meter row length and green fodder yield.

• Increased nitrogen rate increased number of leaves and promotes good plant growth, which leads to higher biomass production with improved forage quality (protein).

• Increase in nitrogen fertilization with increase in seed rate gives higher green forage yield and higher dry matter yield.

Based on the above result the following recommendations were forwarded.

• For better biomass yield with improved dry matter yield, S3N3 i.e., 100 kg/ha seed rate at 150 kg/ha nitrogen can be recommended for use by farmers in Sirinka area and other areas having similar agro-ecologies and soil type.

• Further assessment of the oats production for its performance over years, across diverse agro-ecologies and on-farm farmer managed plots is also vital to more fine-tuned recommendation.

To know about Open Access Publishers

Iris Publishers- Open access Journal of Educational Research | Case Study on Identifying the Reasons for Inferior Quality of Education at the Primary Level, Village Hameed District Attock, Pakistan


Authored by Muhammad Usman*,

Abstract

The aim of this study is to identify the reasons explaining the low quality of education in the public primary schools in UC-21 village Hameed, District Attock, Pakistan. The study is based on primary data which was collected through questionnaires. A total of 76 respondents were included in the sample comprising 40 students, 20 teachers, 10 parents, 4 head teachers and 2 education officers. The findings reveal that lack of human and material resources were the major reasons for the low quality of education. Based on the findings, key recommendations are suggested to improve the quality of education at the primary level, such as construction of new rooms and recruitment of new teachers. Further research is required to confirm if similar problems are pervasive in other rural schools of Pakistan.

Introduction

Education is the fundamental right of every citizen. Education should be free and compulsory at least up to the elementary level. According to the Universal Declaration of Human Rights (UDHR) 1948 under article 26 (1) A. Education facilitates people to realize their potential and their capabilities, indeed education plays a vital role in economic development (Bloom, 2006). Education plays a vital role in economic development. A well-educated society has the potential of transforming into higher rates of innovation. Consequently, higher rates of innovation accompanied with new technology and improved production methods could enhance the overall productivity of firms [1]. Education is crucial in helping people break the cycles of poverty and consequently leads to inequality reduction within a society. Education promotes healthy lifestyle and enhances tolerance between people, thus contributing to a more peaceful society [2].

In spite of missing the target of MDG 21 (upe) that was due by 2015, developing regions have achieved some positive results. Primary net enrolment rates2 have increased considerably from 83% to 91% in 2015. Similarly developing countries have seen the number of primary aged out- of-school children fall from 100 million in 2000 to an estimated 57 million in 2015 [3].

Sub-Saharan Africa has shown tremendous achievements. In Sub-Saharan Africa alone, the number of enrolled children in primary schools has increased at an exponential rate from 62 million to 149 million during the span of just 22 years (1990-2012). As a result, the worldwide youth literacy rate has also increased to 91 percent in 2015 (ibid).

However, the issue of low quality of education is a big concern for developing countries. Especially in sub–Saharan Africa and South Asia, a large proportion of enrolled children are unable to acquire basic literacy and numeracy skills (World bank 2006 p.13). For instance, in Nigeria, 40 percent students of grade 4 are not able to replicate a single word from a passage. In India, 50 percent students of grade II and grade V were unable to do a two-digit subtraction.

According to the Annual status of education report Pakistan (2013), only 43 percent students of grade V can perform grade II level mathematical operations, while 51 percent students of the same grade can read grade II level Urdu language sentences [4]. Moreover, Pakistan was ranked at 118 out of 129 countries in the Education for all Development Index (Unesco 2012, p. 289).

This Paper attempts to find out the causes of the low quality of education in rural Attock District, in village Hameed, Pakistan. The researcher adopted an analytical approach to identify the reasons for the low quality of education. In depth interviews with students, teachers, and head- teachers and educational officials were conducted for the collection of empirical data.

The State of the Education Sector in Pakistan

The education sector of Pakistan has gone through some drastic changes since its independence in 1947. The government of Pakistan is committed to ensure free primary education to all its citizens. In doing so, Pakistan has made international commitments like “Millennium Development Goals” and “Dakar framework of action Education for all” (EFA) signed by world leaders in the year 2000 (Education for all review report in Pakistan, 2015, p. 7- 11). In the last few decades, the government of Pakistan has taken various policy initiatives to increase the literacy rate and to improve the access of primary education; for instance, the “Nationwide Literacy Program” (1986-1990), “National Education Policy” (1992) and “National Education Policy” (1998-2010). The main aim of these policies was to increase enrolment rates at the primary level [5]. As a result, the primary net enrolment rate has steadily increased from 59% to 77% between the years 2000 to 2016. The gross primary enrolment rate3 has also increased from 71.2% to 97% during 2000 to 2016 (Pakistan education statistics, Retention rates4 at the primary level have also shown some improvement. An increment of almost 8% percentage points has been witnessed from 59% to 66.8% between 2000 to 2012-13. In the context of gender inequalities, the Gender parity index5 stood at 0.86 for the year 2013 (Education for all review report, 2015 pp.19-28). However, in spite of these improvements at the primary level, the country still faces some serious challenges. An estimated 5 million children of primary age schooling are out of school. There are severe gender disparities between poor and richer families regarding education. Girls from poor families only receive 1.01 years of education as compared to girls belonging to rich families which receive 9.39 years of schooling throughout their whole lives [6].

Another concerning issue for the government of Pakistan is the low quality of education at the primary level. A first major assessment was conducted by World bank in 1984 to measure the learning achievements of primary level students under the project named “Primary Education Project”. This assessment compared science and mathematics scores of 3,300 students of grade 4 and grade 5 respectively. These students were selected from three provinces i.e Punjab, Sindh and N.W.F.P. The achievement scores for the students of all three provinces were quiet low (Unesco,2002).

According to the Global competitiveness report [7], Pakistan was ranked at 112 out of 144 countries with regard to quality of primary education with a value of 3 out of 7. In the context of the south Asian region, Pakistan was ranked the lowest when compared with its neighboring countries like Bangladesh and India [7]. This proves that quality at the primary level of education is very low and that drastic changes are necessary in order to overcome the existing challenges.

Statement of the Problem
irispublishers-openaccess-educational-research

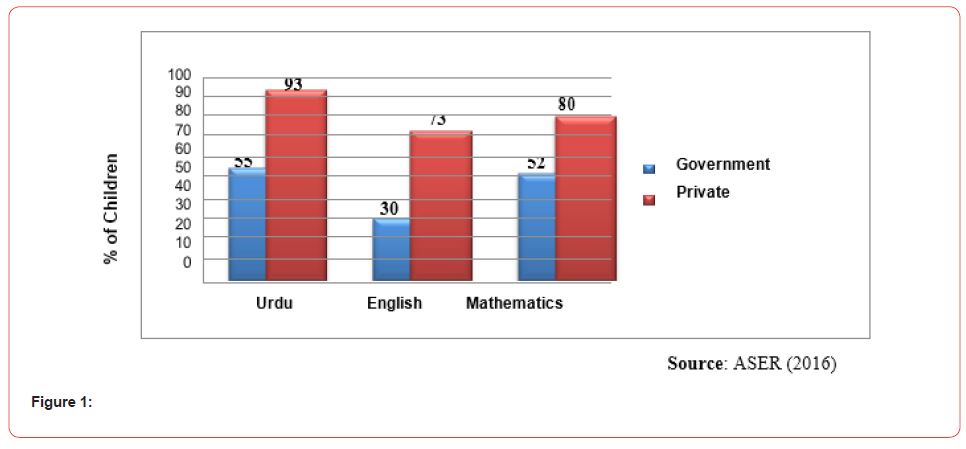
According to the Annual status of education report (2016), in the rural district of Attock, 60% of primary age children are enrolled in public primary schools while 34% are enrolled in private primary schools. This shows the high percentage of children enrolled in public primary schools in rural areas of the district Attock. The report also assessed the learning levels of primary students in Urdu, Mathematics and English. The figures are shown in the following bar chart (Figure 1):

The assessment survey included story and letter writing for English and Urdu. For Mathematics, only basic arithmetic functions (division, multiplication, subtraction, addition) were a part of the assessment survey. It can be seen that there exist learning inequalities between students from public and private schools. In all three subjects, students belonging to private schools outperformed students who are enrolled in public primary schools [8]. According to another report of ASER (2012) in the district of Attock, 58% of the children of grade 5 were three years behind with respect to their competency level. They were unable to read story texts of grade 2 in Urdu, 49% of grade 5 were unable to read story texts of grade 2 in English and 66% were unable to do divisions of grade 2 Math. This shows that most of the students are three years behind with respect to their competency levels [4].

The prevailing low learning levels in public primary schools have motivated the researcher to conduct a study to identify the reasons for poor quality of primary education in UC-21 Village Hameed, District Attock. Most of the studies so far have been conducted on urban areas. There is very little evidence available for rural areas and especially at the village level. This study would be the first one to analyze the reasons for low learning levels that exist at the very micro level.

Conceptualizing the term Quality of Education

The concept of quality of education is a very controversial topic. The term quality is very subjective and has diverse interpretations by individuals and international organizations. Quality has been stated differently by diverse categories of stakeholders. Adams (1993) defines quality as the extent to which set targets and goals are achieved. The term quality has often been interpreted, synonymously with effectiveness, equity, efficiency, and equality. The concept quality of education is somewhat elusive as it involves the complications of the teaching- learning process (Mirza, 2003). Quality of education is a composition of six components. These are reputation of the institution, quality of basic resources and inputs, processes, content, outputs and outcomes and value added [9].

Hawes and Stephens (1990) interpreted the term quality of education as a composition of three dimensions; Efficiency in achieving the declared targets, its appropriateness to human conditions and needs and “something more” in the context of happiness and betterment. In the context of quality, efficiency is demonstrated as making the best use of inputs or getting the maximum out of the available limited resources to improve the learning skills of students. Relevance is context specific considering the present and future needs of learners. “Something more” refers to the extra quality of creativity, innovation, and happiness for others, which are rarely observed in school environment [10].

In 2005, UNESCO formulated an educational quality framework, it was named “Education for all; The Quality Imperative”. The framework underpins four major factors; (1) characteristics of learners such as their social and economic background, health, prior learning, and religious affiliation etc. (2) The educational context where the learning takes place. (3) The enabling inputs such as availability of rooms, teachers, water and sanitation facilities and availability of instructional materials etc. These are important as a lack of enabling facilities would undermine the learning levels of students. (4) Lastly, the outcomes are mostly asserted as achievement scores or exam performance [1].

Factors affecting quality of education

This part of the paper focuses on the factors that have an impact on the achievement scores of students. Factors are categorized as; physical school facilities, class size/pupil-teacher ratio, availability of quality teachers and teaching aids/instructional materials, teaching methods and parental involvement. These factors are selected after reviewing thoroughly the related literature of the term quality of education. Moreover, these are also selected on basis of the proposed definition of the term quality of education by the author himself.

The availability of basic school facilities such as rooms, blackboards, water and sanitation facilities, teachers, libraries and laboratories etc. are strongly linked with achievement scores of students/quality outcomes. Mbole nakong et al (2016) had observed a strong correlation between school facilities and pupils’ achievement in the west region of Cameroon. By conducting regression analysis, they concluded that basic school facilities are one of the profound determinants of pupils’ achievement scores. Quality of education heavily depends on the availability of school facilities in which the teaching-learning process takes place. Lack of adequate facilities and instructional materials had a negative impact on the quality of education in Ethiopia (Afework & Asfaw, 2014). In developing countries, there exist huge disparities among rural and urban schools in terms of sanitation facilities. The unsatisfactory and appalling facilities often result in health-related issues and thus such schools are not regarded as secure places for children to learn. These inferior sanitation facilities have a stronger negative impact on girls compared to boys. Girls who are in menstruation cycle often miss the schools because of the lack of clean sanitation facilities. Moreover, they find it difficult to catch up with the lessons. As a result, they often drop out from school [11].

Class size is defined as the total number of students an instructor teaches in a classroom at a given point of time. Class size and pupilteacher ratio are often used interchangeably to show how many pupils are accommodated by an educator (UIS). In this regard, it is pointed out that reducing the number of students in a classroom will help the instructor to gain in-depth understanding of student’s needs via more detailed and focused discussions (OECD).

According to several studies, a smaller class size is positively correlated with student achievement. Filling classes with a large number of students negatively influences the learning process. Teachers are found to be more satisfied and efficient and able to give attention to every individual when the total number of students in a class is kept around 25. It has been found in a study that children were likely to score 1.5 times lower scores and a decreased survival rate [12]. Dabo (2015) found that due to the expansion in enrolment of students at primary level in Bauchi state, Nigeria, classes got overcrowded. It had interrupted the teachinglearning process. Students were no longer showing any interest in learning. Teachers were facing all sorts of issues such as evaluation and management problems etc.

Class size is defined as the total number of students an instructor teaches in a classroom at a given point of time. Class size and pupilteacher ratio are often used interchangeably to show how many pupils are accommodated by an educator (UIS). In this regard, it is pointed out that reducing the number of students in a classroom will help the instructor to gain in-depth understanding of student’s needs via more detailed and focused discussions (OECD).

The quality of teaching-learning process heavily depends on the quality of human resources available at school. Teachers are considered to be the vital part of an educational system. They are one of the key determinants of students’ achievement [12]. Teacher quality is determined by the qualification and years of teaching experience [13]. Strong (2011) described five characteristics of teacher quality. These characteristics are years of teaching experience, former education, certification received, coursework taken to teach the subject and students exam scores.

According to Unesco [14], the world needs 24.4 million teachers at the primary level to provide primary education to children. More specifically, South Asia, being the second largest region in terms of non-availability of teacher’s requires 4.1 million teachers at the primary level of education. Creamer (1994) asserts that due to lack of teachers, on duty teachers must take extra classes. The heavy burden of classes and extra workload hinders the teaching learning process. This in turn, affects the learning process for students.

The phrase “parents’ support and involvement” refers to numerous kinds of actions, ranging from home based to school level. It includes giving support and helping children at home with homework and attending school meetings. Parents’ attitude towards their children motivates them to put more effort in educational activities. (desforges & abuchaar, 2003). Baker (2003) asserts that home environments differ in many ways such as the parents’ socioeconomic background, level of education, occupation, values and beliefs, interests, and expectations for their children etc. Same as home environment parents’ involvement also differs in many aspects and so as the pupils’ academic performance. Home environment and parental involvement considered to be a one component of learning institution for the learners (Baker 2003) [15-17].

Mahuru & Hungi carried out a study in Iganga and Mayuge districts in Uganda. They estimated the impact of parental participation and support on academic performance of students. Study was carried out in both public and private primary schools. They concluded that one unit increase in parental participation and support increases the performance of students by 6 to 15 percentage points. Moreover, they found increments of 6 to 12 percentage points in literacy scores of students [18-20].

Research Methodology

This section provides the details regarding the different procedures used to conduct this study. It includes targeted population, sample size and techniques, data collection tools and data analysis procedures.

Targeted population

The targeted population of this study includes public primary schools situated in UC-21 village Hameed constituency. Union council -21 has got four villages namely, Pethi, Kaaloo, Peerrzai and Hameed. UC-21 Hameeed has eight public primary schools. Each village has two public primary schools one for girls and one for boys. For this study, only 4 public primary schools were selected one from each village. Of these four, two girls and two boy’s public primary schools were included.

Head teachers, teachers, students, parents, and education officers were included to find the reasons of low primary educational quality.

Sample size sampling techniques

All respondents were selected randomly for this study. A total of 76 respondents were selected. From these, 4 head teachers, 20 teachers, 40 students, 10 parents and 2 education officers were interviewed to get the required information.

Sources of data and data collection tools

The author has used primary data for this study. Questionnaires were created to collect primary data for the analysis part. Questionnaires were translated into national language (urdu) for the ease of respondents. Five different open –ended and close ended questionnaires were used to retrieve responses.

Data analysis procedures

The conceptual framework illustrated in figure 2 has been used to examine the responses and to identify the reasons of the low quality of education at the primary level. The conceptual framework measures quality of education from two different dimensions; (1) physical factors categorized as inputs and teaching learning process categorized as process factors. Tabular interpretations and charts have been used to analyze and present data.

Data Analysis, Presentation of Findings, and Interpretation

Perceptions of Head teachers and Teachers about the adequacy of selected physical facilities in the schools

The study sought to find out the availability of physical facilities and their impact on the quality of education in the public primary schools. For this purpose, both the head teachers and teachers were questioned to specify whether they were satisfied with the adequacy of physical facilities in their schools or not. The responses by both the head teachers and teachers are summarized below in the following table (Table 1).

irispublishers-openaccess-educational-research

Table 1: Responses on the adequacy of the selected physical facilities in the public primary schools as specified by the head teachers and teachers.

irispublishers-openaccess-educational-research

From the findings of the study as shown in Table 5, all the head teachers 4 out of 4 (100%) and 16 teachers (80%) out of 20 reported water and sanitation facilities as adequate. In addition, all the head teachers 4 out of 4 (100%) and 19 (95%) teachers indicated that their schools had adequate textbooks for the students. However, most of the respondents stated that they were not satisfied with the availability of classrooms 22 (91.6%) out of 24, electricity 22 (91.6%) out of 24, and library 23 (95.8%) out of 24 [21-24].

From the respondents, all the head teachers indicated that their schools had inadequate classrooms, electricity, and library. The responses of teachers were quite like those of the head teachers. Out of 20 teachers, 18 (90%) reported inadequate classrooms, 18 (90%) indicated lack of electricity and 19 (95%) mentioned inadequate library in their schools. Lack of physical facilities negatively influences the quality of education. For instance, inadequate classrooms force teachers to teach multigrade congested classes. Moreover, congested classrooms resulted in management issues for instructors. In addition to that, non-availability of electricity made the matters worse. Students find it difficult to concentrate on what is being taught. The high number of responses confirms that availability of physical facilities does matter for the quality of education. These findings are in line with the findings of Abdullahi (2013) who found that lack of physical facilities was a major factor in influencing the quality of education in public primary schools of Mombisa district, Kenya [25-28].

Perceptions of head teachers and Teachers about teachers’ adequacy, pupil teacher ratio and teachers’ workload

To find out the faculty and teaching situation in the schools, three indicators were used, availability of teachers, pupil teacher ratio and teachers’ workload. Head teachers were asked whether they had the required number of teachers or not in their schools.

It shows that 3 (75%) out of 4 head teachers reported that their schools did not have enough teachers. This might be one of the reasons that why the quality of education is low in the public primary schools of UC-21 Hameed, Village. These findings are in line with the findings of Creamer (1994) and Osman (1989), who found that shortage of teachers undermines the effective teaching and thus negatively influences the quality of education [29-30].

Teachers were further asked to indicate the number of students they teach in a given classroom. The findings are tabulated below (Table 2).

Table 2 indicates that out of 20 teachers 9 (45%) reported that they had a teacher-pupil ratio of 1:45. Furthermore, 7 (35%) out of 20 teachers indicated pupil teacher ratio of 1:40. This means that 16 (80%) out of 20 teachers had 40 and 45 students in their classes. On the other hand, 5 (20%) out of 20 teachers said they had pupil teacher ratio of 1:25, 1:30 and 1:35 respectively. From the findings, it is evident that majority of the teachers (45%) had pupil teacher ratio of 1:45 which was greater than the internationally recommended pupil- teacher ratio of 1:40 for developing countries (Unesco, 2011).

Table 2: Responses of teachers about the number of students they teach (pupil teacher ratio).

irispublishers-openaccess-educational-research

Furthermore, teachers were asked whether they were satisfied with the given teacher-pupil ratios to investigate the impact of pupil teacher ratio on the quality of education. The responses are presented below (Table 3).

Table 3 demonstrates that 16 (80%) out of 20 teachers were not satisfied with the number of students they had in their classes. The author further questioned them about the reasons for dissatisfaction. All the 16 (80%) respondents indicated that such a huge number of students cause discipline and management issues which make it harder for them to teach students with full concentration. Consequently, high pupil teacher ratio negatively influences the teaching- learning process and thus the quality of education. From the findings, it is evident that the public primary schools in UC-21 Hameed, Village had high pupil teacher ratios. The high number of responses against the high teacher-pupil ratio confirms that pupil teacher ratio does matter for the quality of education. These findings support the findings of shad & inamullah (2012), and Carlson (2000), that the smaller class size positively influences the quality of education [31-32].

Table 3:Responses of teachers on the satisfaction of pupil teacher ratio.

irispublishers-openaccess-educational-research

To seek information about the teachers’ workload, teachers were inquired to indicate the number of lessons they teach on weekly basis. The responses are tabulated below (Table 4).

The Table 4 reveals that 13 (65%) out of 20 teachers had 49 lessons per week. It means 7 lessons on daily basis. 7 (35%) out of 20 teachers said they had 35 lessons per week. Teachers were further asked about their workload as heavy or light. All the teachers reported their workload as heavy. These findings also confirm that schools did not have enough teachers. Due to this, teachers were forced to take the extra burden and teach a lot of lessons. These findings confirm the findings of creamer (1994) who found that due to a shortage of teachers, on duty teachers must teach extra classes that undermines the effective teaching. Shortage of teachers and heavy workload might be the reasons that negatively influence the quality of education in the schools [33].

Table 4:Responses of teachers on workload.

irispublishers-openaccess-educational-research

Perceptions of students about teaching techniques, homework assignments, assessment, and feedback

The study tried to analyze the impact of teaching styles, teachers’ motivation, assessment, and feedback on the quality of education. Teaching styles were classified into two categories: traditional methods as direct lessons and participatory methods as active involvement of students. Students were asked to indicate the type of teaching techniques their teachers employ during teaching. The responses from students are tabulated below (Table 5).

Table 5:Responses of students on teaching styles.

irispublishers-openaccess-educational-research

Table 5 shows that 32 (80%) out of 40 students indicated that their teachers employed traditional methods during teaching. While 8 (20%) out of 40 reported that their teachers employed participatory methods during teaching lessons. The students were further questioned whether they were satisfied with respective teaching techniques. 29 (90.6%) out of 32 (Direct lessons) said they were not satisfied with the way of their teachers’ teaching methods. Students were further asked to identify the reasons for dissatisfaction. They mentioned that direct lessons were too boring for them. They sat silently and were forced to take notes. They were not allowed to inquire about anything. Even in most of the cases, teachers had not been taking lessons seriously. These findings reveal that direct lessons or traditional way of teaching were dominant in the public primary schools.

The study further inquired about the homework assignments, assessment, and feedback given to students by their teachers. Assessment and feedback are an integral part of the teachinglearning process. Students were asked to indicate about whether they get homework assignments or not and whether their teachers do any kind of assessment and provide feedback to them. Responses from students are tabulated below (Table 6).

Table 6:Responses from students on homework assignments, assessment, and feedback.

irispublishers-openaccess-educational-research

From the findings of table 6, it is evident that the schools lacked assessment and feedback. Majority of the students, 32 (80%) out of 40 mentioned that their teachers gave homework assignments to them. 36 (90%) students out of 40 said that their teachers neither did assessment nor did they provide any sort of feedback on their homework assignments. The students further mentioned the extent of the lack of assessment and feedback by saying that most of the time class representative does the assessment and report it to teachers. This shows the extent of the weakness of assessment and feedback process in the public primary schools.

Dominant traditional teaching approaches and lack of assessment and feedback might be the reasons contributing to the low quality of education in the schools. These findings affirm the findings of Ali. et al (2010) and Staub & Stern (2002) who established that constructivist teaching approaches and ongoing assessment and feedback enhance problem -solving skills and help learners to work on their mistakes. Consequently, these approaches make teaching- learning process more effective.

Perceptions of teachers about their motivation

The teachers were asked to indicate whether they feel motivated in performing their teaching duties. The responses from teachers are presented below.

Majority 15 (75%) out of 20 teachers said that they did not feel motivated in performing teaching duties, while only 5 (25%) out of 20 teachers were felt motivated in performing their duties. Teachers who felt demotivated were further asked; what are the reasons for their demotivation? (Table 7).

Table 7 reveals that the majority of 9 (60%) out of 15 teachers said due to low wages, heavy workload, and a shortage of teachers they felt demotivated. 2 (13.3%) out of 15 and 3 (20%) out of 15 indicated that due to heavy workload, shortage of teachers, lack of incentives and no promotion caused them demotivation. From the findings, it is evident that majority of the teachers were demotivated and hence this negatively impacted the quality of education in the public primary schools in UC-21 Hameed, Village.

Table 7:Reasons for demotivation.

irispublishers-openaccess-educational-research

Perceptions of parents about the quality of education

Parents were questioned about the quality of education in the schools. They were asked to indicate the factors that contribute in a negative way on the education performance of their children. Their responses are tabulated below (Table 8).

Table 8 shows that 6 (60%) parents out of 10 indicated the shortage of rooms and teachers as the main reasons for the low quality of education. The high percentage response in favor of shortage of rooms and teachers are in line with the earlier findings that schools lack both human and material resources.

Table 8:reasons for the low quality of education in the eyes of parents.

irispublishers-openaccess-educational-research

The remaining 4 (40%) parents out of 10 indicated the Appointments of teachers on political basis as the main reason for the low quality of education. They further added that; “Political favoritism is the main cause for the low quality of education. Since teachers have political connections, they do not take their work seriously. And they know they are not accountable to anyone” (interviewee 66, 69, 70, 71).

The above findings suggest that apart from school-based factors there are other factors too that could be the reasons for the low quality of education. Factors like these could be classified under the umbrella of contextual factors in which the whole working of the education system takes place.

Perceptions of students, teachers and parents about parents’ educational support and involvement in school activities

The study also sought to find out the involvement of parents at home and in school activities. For this purpose, parents were asked to specify whether they receive invitations from school authorities for attending meetings or not. Majority 17 (85%) out of 20 parents indicated that they did not receive any invitations form school authorities to attend meetings. To get a clearer picture of the parents’ involvement in their child education; teachers were asked to indicate whether parents visit the school to inquire about their child education performance or not.

Perceptions of students, teachers and parents about parents’ educational support and involvement in school activities

The study also sought to find out the involvement of parents at home and in school activities. For this purpose, parents were asked to specify whether they receive invitations from school authorities for attending meetings or not. The responses from parents are tabulated below.

The majority, 17 (85%) out of 20 parents, indicated that they did not receive any invitations form school authorities to attend meetings. To get a clearer picture of the parents’ involvement in their child education; teachers were asked to indicate whether parents visit the school to inquire about their child education performance or not. The responses from teachers are summarized below.

Data shows that majority 15 (75%) out of 20 teachers said that parents did not come to school to inquire about their child education performance. Students were further asked to mention whether their parents provide them with any educational support at home or not. Responses from students are presented below in the following figure.

It reveals that majority 26 (65%) out of 40 students reported that they did not receive educational support from their parents at home. 14 (25%) out of 40 said they received educational support from their parents at home.

Above all, it is evident from the findings that schools lacked the parental support and involvement. On first-hand, school authorities were responsible for not inviting parents to attend meetings. Secondly, parents were equally responsible for not providing educational support to their children at homes. Lack of support both from teachers and parents has negatively influenced the quality of education in the public primary schools. These findings support the conclusions of Mupalika (2014) and Iqbal et al (2010) who found considerable variation in the educational performance of students who had parental support as compared to students without parental support.

Perceptions of Educational Officials about the Quality of education

The educational officials were interviewed to know their perceptions about the quality of education. They were asked to indicate.

• what are the reasons for the low quality of education in your area?

(1) Shortage of human and material resources and (2) Corporal punishment

The educational officials indicated the shortage of teachers, rooms, and unavailability of electricity as the main reasons for the low quality of education in the schools. In addition, they added that in some cases they had received complaints from parents about the corporal punishment given by teachers to students. They further mentioned that corporal punishments could make students disinterested in school. This could impact the performance of students. Since disinterested students won’t put much effort in their studies.

• In your opinion, what are the factors that could contribute in a positive way to student’s performance?

(1) Teachers’ attention and (2) supervision

According to educational officials, students’ performance could be improved by teachers’ attention and supervision. They indicated that teacher’s need to put more effort into their work. Teachers’ attitude and behaviour towards students should be very kind and friendliness. In addition, they should honestly do an assessment and should provide feedback accordingly. Teachers are an integral part of the teaching-learning process, and they should guide their students and act as their facilitators.

• In the past five years, which steps you took to improve quality at the primary level?

(1) Effective monitoring and (2) huge investment in building infrastructure

The educational officials reported that in the last five years educational authorities have improved a lot in monitoring and supervising activities. In addition, the government has also taken investment initiatives to improve infrastructure.

From the findings, it is evident that schools had inadequate human and material resources. Educational officials did mention about the steps taken by the government to improve quality of education. However, from the responses of head teachers and teachers in regard to the adequacy of physical facilities and teachers, still more is required to overcome these challenges.

Apart from the stated reasons in questionnaires, respondents were further asked to indicate any other factors they might think responsible for the low learning levels of students. They stated the following reasons.

• Compulsory to promote students to next grade even if they fail the exams

3 (75%) out of 4 head teachers stated that promoting students to next grade even if they fail the exams might have a negative impact on the performance of students. According to the head teachers, this policy was implemented in 2012 to encourage students to perform well in exams. However, they said that this policy might be having a negative impact on the performance of students. Students know that their effort does not matter in the end they will be promoted to next grade.

• No extracurricular activities

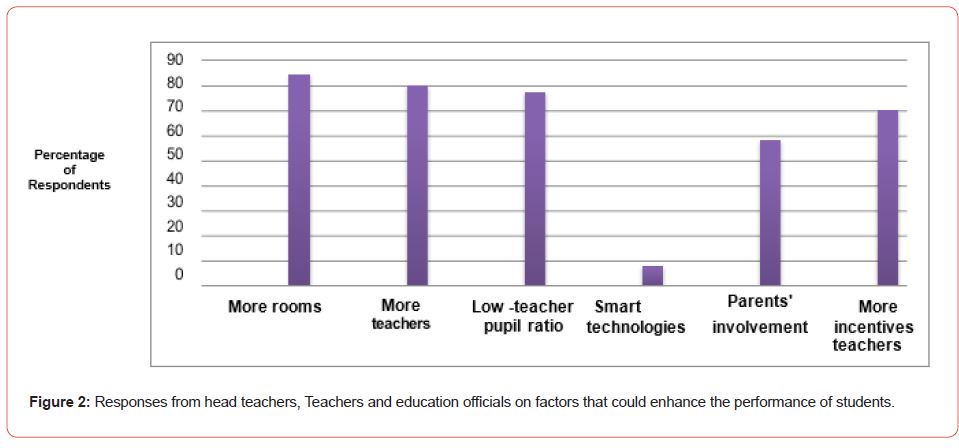
Few of the teachers’ respondents, 8 (40%) out of 20 said that due to the absence of extracurricular activities in schools, students did not find school an attractive place. Head teachers, teachers and education officers were asked to indicate which changes they would like to see that could have a positive impact on the performance of students. The responses form head teachers, teachers and education officers are tabulated below (Figure 2).

Figure 2 shows that majority of the respondents 22 (84%) out of 26 said that more rooms should be built. Moreover, 21 (80%) out of 26 respondents said that more teachers should be recruited to decrease the workload on teachers. 20 (77%) out of 26 indicated that teacher-pupil ratios should be decreased. 15 (58%) out of 26 suggested that parents should involve themselves in school activities and 18 (70%) out of 26 respondents said that incentives should be provided to teachers to make them motivated for teaching duties. While 2 respondents (8%) out of 26 mentioned the installation of smart technologies.

Conclusion

The findings of this study reveal the reasons for the low quality of education in the public primary schools in UC-21, Hameed Village. From the findings several conclusions were made; firstly, the schools had inadequate teaching-learning facilities such as rooms, electricity, labs, and libraries. Schools had high teacherpupil ratio. In-adequacy of teaching-learning facilities and high teacher-pupil ratio both affected the quality of education.

Secondly, the schools had shortage of teachers. Due to shortage of teachers on duty teachers had to deliver 35 and in some cases 49 lectures per week. This resulted in heavy workload for teachers. Moreover, traditional teaching techniques were very common in the schools. Students were given homework assignments, but they did not receive any feedback on their work. Teachers’ motivation was very low due to heavy workload, lack of incentives and promotion and low pay scale. All these factors had a negative impact on the teaching-learning process. Consequently, it affected the quality of education. Thirdly, parents’ involvement in school activities and at home was very limited. It was further noted that school authorities had not been taking efforts to indulge parents in school activities. Hence, there is no single factor that could be linked to the low quality of education. All the above-mentioned factors are related to each other and had a direct or indirect impact on the quality of education.

To read more about this article...Open access journal of Educational Research

Please follow the URL to access more information about this article


To know about Open Access Publishers

Iris Publishers-Open access Journal of Hydrology & Meteorology | Influence of Community Resilience to Flood Risk and Coping Strategies in Bayelsa State, Southern Nigeria

  Authored by  Nwankwoala HO *, Abstract This study is aimed at assessing the influence of community resilience to flood risk and coping str...