Authored by Min Lu*
Abstract
Since instances of coronavirus disease 2019 (COVID-19) community spread emerged in the United States, federal and local governments have implemented multiple containment measures. However, in order to satisfy the needs of citizens, the strictest containment measures can be only executed for short period. This article compares two types of containment strategies: a constant containment strategy that could satisfy the needs of citizens for a long period and an adaptive containment strategy whose strict level changes across time. When to implement the strictest measures is also of interest. A prediction model is proposed and a simple tool is developed for policy makers to compare different containment strategies. As an example, a county with 2.8 million populations with initial 200 infected cases is considered, where about 0.2% people dead during the pandemic. Compared with a constant containment strategy, adaptive containment strategies shorten the outbreak length, but executing the strictest measures late, even with stricter overall containment measures, will cause more mortality.
Keywords: Containment measures;; Incubation period; Infectious period; Pandemic; Period of communicability; Survival function.
Introduction
To prevent the spread of a new respiratory disease - coronavirus disease 2019 (COVID-19), policy makers rely on prediction models to foresee the dynamic of infected cases and prepare for adopting containment measures including patient quarantine, active monitoring of contacts, border controls, and community education and precautions [1-4]. There are many prediction models available for the COVID-19 pandemic [5-7,6-11,12,13,14]. To apply them for predicting local COVID-19 spread, there are two major challenges. Firstly, number of actual infected cases is usually unconfirmed and could be far larger than confirmed cases because there is significant number of infected cases in incubation period and test kits may be insufficient. On the other hand, regions that experienced earlier outbreaks can provide valuable information, such as the distribution of cure time, death time, and mortality rate [15], but it is not easy to integrate these dynamic parameters into most of the current models.
This article provides a simple and robust model framework whose parameters are dynamically adjustable and generally inter pretable for policy makers. The model allows unconfirmed infected cases and confirmed infected cases have different transmissibility. Survival analysis is integrated in it to borrow information from regions that experienced earlier outbreaks. Moreover, the model enables containment measures to change over time [16] through introducing a novel reproduction number which incorporate containment measures and the basic reproduction number (R0).
The Model
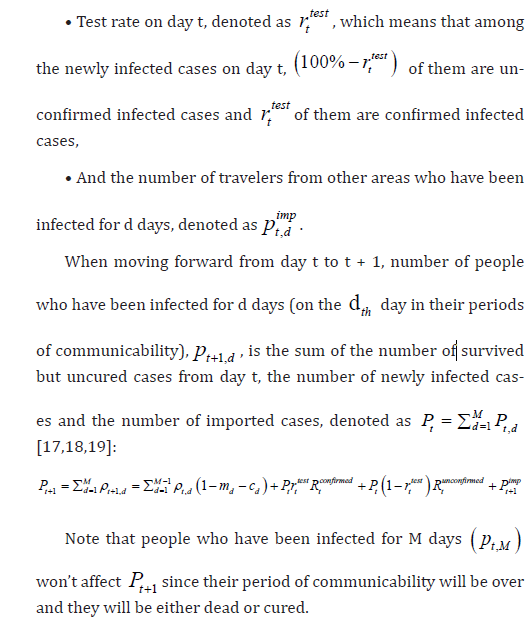
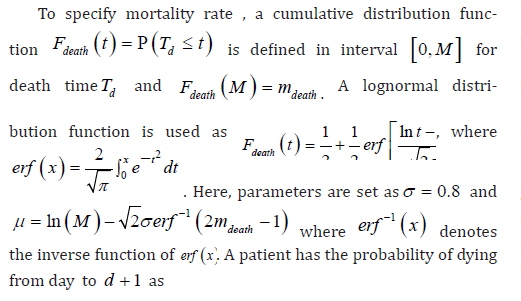
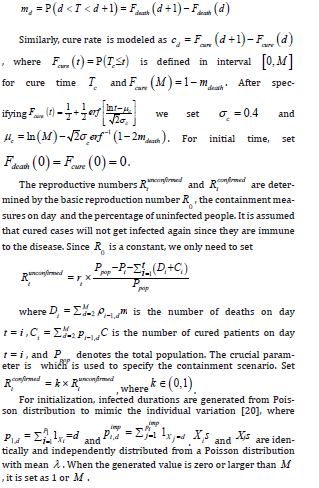
Assume the disease of interest has an M-day period of communicability so that infected people are either cured or dead within M days. Denote the mortality rate within an infectious period as mdeath and the cure rate will be 1−mdeathOn day t, denote the number of people that have been infected for d days as p t,d and the total number of infected cases is Pt = PM d=1 p t,d.p t,d is determined by the following factors:.
• Mortality rate for people that have been infected for d days, denoted as m d,
• Cure rate for people that have been infected for d days, denoted as c d,
• number of people that an infected person can communicate on day t: when an unconfirmed infected case (for the reason of incubation period or insufficient test kits) pass the disease, it is denoted as reproductive number R t unconfirmed for a confirmed infected case, it is denoted as R t unconfirmed and R t unconfirmed < R t unconfirmed because the person will be either hospitalized or quarantined at home with extra care,

Parameter Specification


Results and Conclusion
To compare different containment strategies, suppose a county is going to experience a COVID 19 outbreak in the scenario illustrated in Table 1. After monitoring 100 simulation replications, the dynamic of infected cases does not change much from random initialization. (Figure 1) In total, numbers of deaths from strategies A, B and C are 5.34×10³, 4.99×10³ and 5.61×10³; numbers of infected cases are 1.87×10⁵, 1.75×10⁵ and 1.97×10⁵. The number of infected cases, Pt , reaches its peak on the 42th, 36th and 35th day and the number of deaths, t D , reaches its peak on the 66th, 59th and 60th day from strategies A, B and C. After the peak of t P , containment strategy does not make much difference on the trend of t P or t D .
As a conclusion, compared with a constant containment strategy, adaptive containment strategies shorten the outbreak length. In order to achieve lower death rate, the strictest measures should be implemented two weeks before the peak of infected cases, instead of executing them during the peak. Adaptive strategy is less strict at the beginning, which results more severe spread. Even that, the following stricter measures effectively shortens the outbreak length [20]. When to choose the strictest measures is critical to achieve minimum total death rate, which is highly affected by the peak of predicted daily infected case under a constant containment strategy. Implementing the strictest measures late even with stricter overall containment measures, will cause more mortality.
To read more about this article...Open access Journal of Biostatistics & Biometric Applications
Please follow the URL to access more information about this article
https://irispublishers.com/abba/fulltext/dynamic-modeling-covid-19-for-comparing.ID.000579.php
To know more about our Journals...Iris Publishers


No comments:
Post a Comment