Authored by Beletech Kindu*,
Abstract
The main objective of this finding was identified adaptation strategies and factors that influence the probability of farmers to choose adaptation measurements in Estie woreda. Mixed research approach was used. Data was collected from 166 households and 5 agricultural experts through questionnaires and interview. The collecting data was analyses by using stata software and statistical software SPSS version 20. Adaptation strategies were considered use new crop variety, irrigation, soil-water conservation and planting trees for this study. The result obtained from multinomial logistics model shows that, adaptation strategies significantly influenced by agro-ecological zone, age, farm income, non-farm income, farm size, distance to the market, access of extension service and climatic information variables. Lack of skills and lack of information were the major barriers stand by farmers to climate adaptation. Therefor agricultural and rural development office as well as the government should be created awareness on climate change adaptation strategies, improve access of agricultural extension service and share for all farmers.
Keywords: Climate change; Smallholder farmer’s; Adaptation strategy
Introduction
In the last decade climate change has become increasingly apparent that it is already happening, and will continue to happen, bringing with its local impacts on people’s livelihoods [1]. The threat of global climate change has caused concern among researchers as livelihoods, agricultural production and food security of the smallholders could be severely affected by changes in key climate variables, which are rainfall and temperature. Climate change could have harmful effect on different biophysical and economic activities like agriculture, water resources, forestry, human health, biodiversity and wildlife. The consequences of climate change are severe in third World smallholding farmer agriculture because it is rain-fed and relies on the mercy of nature [2]. Many African countries which have economies largely based on weather-sensitive agriculture are vulnerable to climate change and become complex challenges on human livelihoods [3] The rapid pace of climate change, along with increasing socioeconomic pressures, threatens to overcome their ability to adapt [2].
Ethiopia is especially vulnerable to climate variability and change because large segments of the population are poor and depend on agricultural income, which are highly sensitive to rainfall variability and change in temperature the [4,5]. These findings show that, most Ethiopian agriculturalists have low access to education, information, technology, and support services, and, consequently, have low adaptive capacity to handle the consequences of climate variability and change. Ethiopia is challenged by social and natural problems. Poverty is estimated that 29% of the total populations live below the international poverty line [6]. Furthermore, Ethiopia has previously suffered from climate extremes, manifested in the form of recurrent drought (1965, 1974, 1983, 1984, 1987, 1990, 1991, 1999, 2000, and 2002) and flooding (1997 and 2006) [7].
The fact that climate has been changing in the past and continues to change in the future implies the need to understand how farmers perceive climate change and adapt strategies to reduce climate impacts in the future. Adaptation can be viewed as reducing the severity of various impacts if adverse conditions overcome. Studies indicate that farmers do perceive that climate is changing and that they adapt to reduce the negative impacts of climate change [8,9]. The success of adaptation strategy depends on the availability of necessary resources (both financial and natural resources) knowledge, technical capability, and institutional resources [10]. In addition, [11] pointed out many social, economic, technological and environmental trends were limited the ability of farmers to perceive and adapt to climate change. Since, Adaptation of smallholder farmers believed that imperative to reduce the impact of climate change and improved the resilience of agricultural sectors [12]. By understanding this fact, effort should focus on the finding of adapting mechanisms. Therefore, this study investigated adaptation strategies to climate change and its determinant factors in the study area by using mixed research approach. The research will contribute to existing scientific Knowledge on adaptation strategies used by farmers.
Methodology
Description of the study area
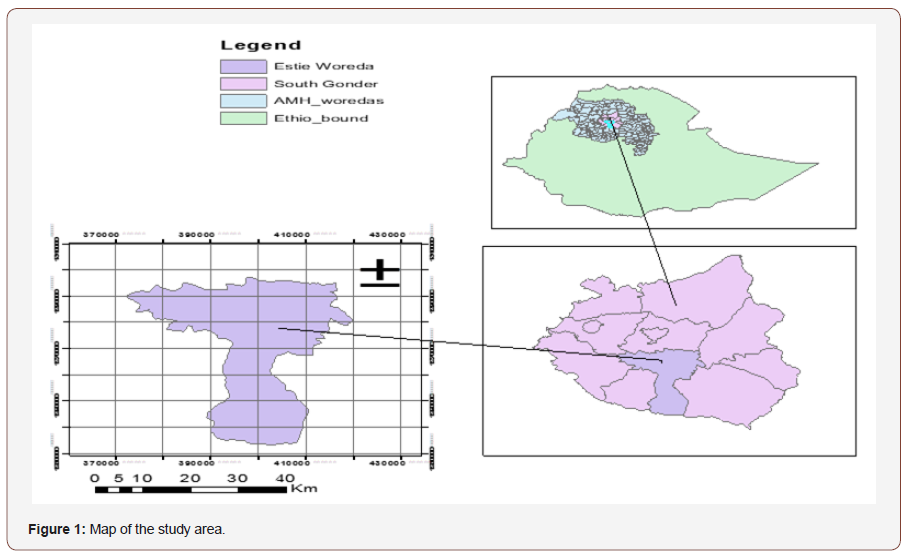
Estie Woreda is located in South Gondar Administrative Zone, Amhara Regional State, Ethiopia. It is about 676 km northwest of Addis Ababa and about 100 km north of Bahr Dar. It has 42 rural kebeles and 3 urban kebeles. Estie is bordered on the north by the Farta Woreda, on the south west Gojam, on the east by Simada Woreda and the last on the west by Andabet and Dera Woreda. This Woreda is located at 11°34’N, latitude and 36°41’E, longitude (Figure 1). The total area of this Woreda is 132,373.9 km2 (from the Estie Woreda agricultural administrative office).
Research design
The researcher was applied mixed research design which, include both quantitative and qualitative approach. The advantage of employing these techniques were get quantitative data such as demographic characteristics of the households’ and investigating the farmers’ perception on climate change adaptation problem, causes and consequences of climate change as well as the limitations and influencing factors for their adaptation strategy of climate change in Estie Woreda qualitatively.
Data source and collection methods
The study was using both primary and secondary data sources. The primary data was obtained from the smallholder farmers through questionnaire and personal interview, Photograph and observation which ensure the consistency and accuracy of the primary data obtained through questioners. Questioners was prepared in English language then after translated into local language which is AMHARIC in order to get perfect information from the respondents since, Amharic language used by all peoples in Estie woreda. Secondary data were incorporated to fill the gap of primarily information. Such data were collected from West Amhara metrological station, published and unpublished agriculture official sources, Books, journals, internet sources, research reports.
Data collection instruments
Questionnaire: Questionnaire is an instrument that the researcher was used to find out information’s related to perception of farmer’s, adaptation strategies which, used by farmers and determinant factors to choose adaptive mechanism to climate change with the help of well-structured questionnaires.
Key informant interview:For the sake of better understanding of some climate change in the woreda, adaptations used by farmers and climate risks in the study area, key informant interviews were made with one Kebele experts from each individual agro ecological zone and two experts of Estie woreda agriculture and rural development office.
Sample size and sampling techniques
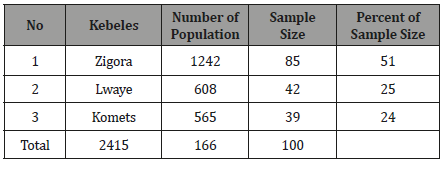
The total households residing in the study area are 2415. Out of this, 166 samples were selected, in order to make representative samples by using the following simple formula Yamane as cited in Israel, 2012.
 at 92.5% confidence level and e = 0.075% precision level.
Where, n is number of desired samples,
N is the estimated population size and
e is level of precision (0.075%) there for based on the formula total sample size was 166 respondents (Table 1).
Table 1:Sample size of household heads.
Sampling techniques
For administrative purposes, Estie is divided in to forty-two rural Kebeles, of the forty-two. First, three kebeles were selected out of forty-two kebeles based on agro-ecological zones and amount of population. These three kebeles are Lwaye (from Dega), Zigora (from Weynadega) and Komesi (from kola). But the researcher did not include any kebele from Wurch agro-ecological zone because based on the Second; by using systematic random sampling method 166 households were selected from the three Kebeles.
Data analysis methods
After the data collected from the sample respondents, statistical package/program from social science (SPSS) software version 20 in order to quantified, coded analyzed and interprets the data as well as give meaning full investigation and stata software and Multinomial logistic model (MNL) model was used in order to identified and understanding the degree explanatory variable influence adaptation strategies.
Descriptive statistic tools like (percentages, means, frequency, count, chi-square, was used to characterize farmer perceptions on changes in long-term temperature and precipitation changes and to give strengthen the findings of Multinomial logistic model. Mann- Kendall test was also used to analysis annual and monthly trend in rainfall/ precipitation and temperature.
Multinomial logistic model (MLM): Undertake a rational farmer who pursues to increase agricultural productions over a specific time and must choose among a set of ‘j’ adaptation options. Hence, the farmer ‘i’ chooses to use ‘j’ adaptation options if the perceived benefit from option ‘j’ is greater than the utility from other options (say, k) specified as: U-ij (β′jXi + εj) > U-ik (β′kXi + εk ), k ≠ j, (1).
where
Uij and Uik are the perceived value by farmer i of adaptation options j and k,
Xi: is a vector of explanatory variables that influence the choice of the adaptation option,
βi and βk are parameters to be estimated and
ɛi and ɛk are the error terms.
To express the MNL model, let y denote a random variable taking on the values {0, 1, 2...J} for J, a positive integer, and let x represent a set of conditioning variables. In this case, y denotes adaptation options like soil-water conservation, crop variety, irrigation etc. and x contains household attributes like age, education, income levels, and others. The question is how cetirus paribus changes in the elements of x affect the response probabilities P (y = j / x), j =1, 2 ...J. Since the probabilities must sum to unity, P (y = j / x) is determined once we know the probabilities for j = 2...J.
Let x be a 1× K vector with first element unity. The MNL model has response probabilities:

Results and Discussions
Farmer’s perception of changes in the precipitation and temperature
The farmers were asked whether they have perceived changes in the rainfall and temperature or not in their locality area. As the above graph shows about 24.7% and 80.7% of the respondents perceived that there is an increment in the level of rainfall and temperature in their local area while about 57.8% and 11.4% of the respondents had perceived a reduction in the level of the rainfall and temperature respectively. In addition, about 9.1% and 3.4% of the respondents were answered there is no change in the level of precipitation and temperature respectively. While about 8.4% and 4.3% of the respondents had not the evidence on the change of rainfall and temperature respectively. These outcomes show that the majority of the farmers in the study area had perceived a decreased as well as an increased in the level of precipitation and temperature respectively (Figure 2) (Table 2).
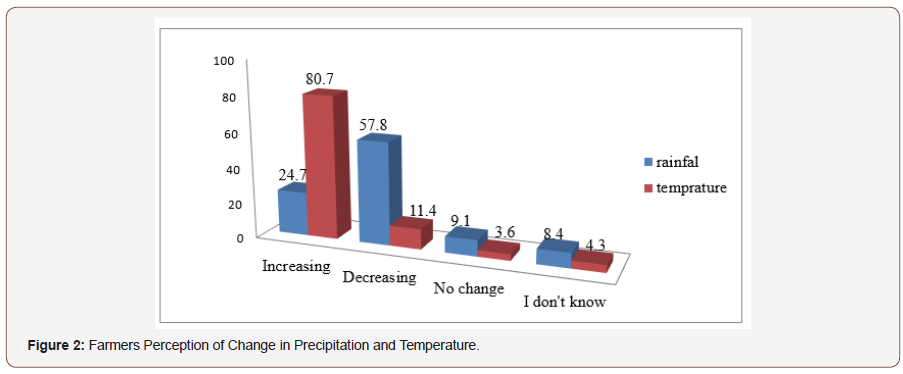
Table 2:Cross Tabulation of Agro-Ecological zone and Adaptation Choice.

The finding shows that farmers perception status and taking adaptation strategies is differ across agro-ecological zone. It that, about 94.9% and 92.3% of the respondents from Kola agro ecological zone had perceived in both precipitation and temperature respectively and about 66.7% of the respondents taken adaptation measures to climate change. However, when we compared to farmers between Kola with Dega and Weynadega agro ecological zones, the respondents who take adaptation measures from Dega and Weynadega agro-ecological zone are relatively lower and higher in perceiving the change. When we go to kola agro ecological zone there were an indicator of climate related problems but the capacity of farmers to taken adaptation mechanism is lower. This is might be due to it long distance which is one factor for farmers could not be applied new agricultural technology, share climatic information etc. Consequently, for this reason could also be lack of infrastructures and low of agricultural extension service relatively from Dega and Weynadega agro-ecological zones. All agricultural experts also answered during the interview, distance and lack of infrastructure were the major factors to implement adaptation measurements and other agricultural policy effectively specially in remote area (Figure 3).
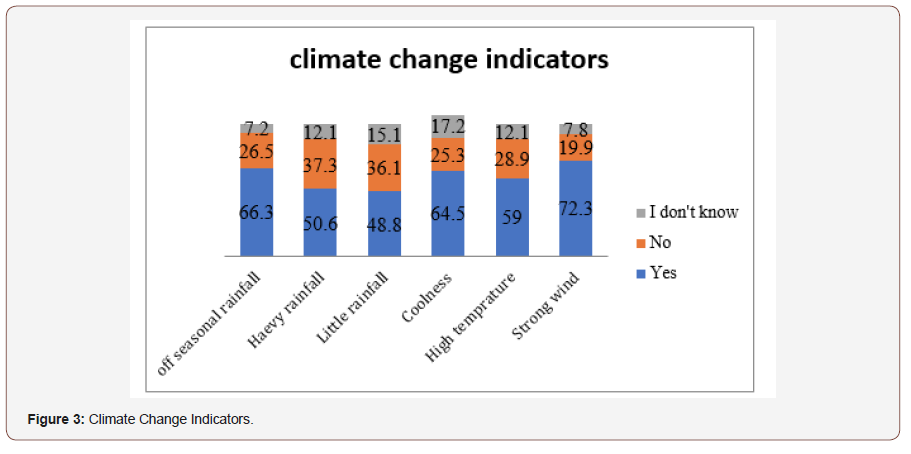
Views regarding climate change indicators were also requested from the respondents. The above figure shows the farmers’ observation of indicators of climate change in the study area. Most respondents had observed the indicators and some of respondents have not observed these indicators but few of respondents had not suggestion. For example, about 66.3% of the respondents perceived off seasonal rainfall while about 26.5% of the respondents had not observed the problem, the remaining 7.2% of the respondents had not proof. In addition, about 50.6% of the respondent show the presence of heavy rainfall, while about 37.3% of the respondents were not observed but 12.1% of the respondents had not suggestion.
On the other hand, about 48.8% of the respondents were answered they perceived the presence little rainfall, while 36.1% of the respondents were not perceived, the remaining about 15.1% of the respondent were neutral. The same thing about 64.5% of the respondents revealed there is exist of coolness/ ice, while about 25.3% of the respondent replied there was not the coolness problem but 17.2% of the respondents otherwise. On other hand, the problem of high temperature was observed by 59% of the respondents and about 28.9% were not observed this problem, while the remaining 12.1% of the respondents were neutral. About 72.3% of the respondents were observed the problem of strong wind while about 19.9% had not observed such problems; the remaining 7.8% of the respondents had not proof. In general, this result shows the farmers were perceived different climate change indicators, which initiates to climate change.
Climate Related Problems in Estie Woreda
There are different climate related problems which could impact on the smallholder farmers in their usual farming activities. However, the intensity of these problems is differing from within a region as well as across regions. In this study the farmers were asked to distinguish the intensity of different climate change related problems in the study area. Based on the respondents answered the intensity of climate change problems is show in the following (Figure 4).
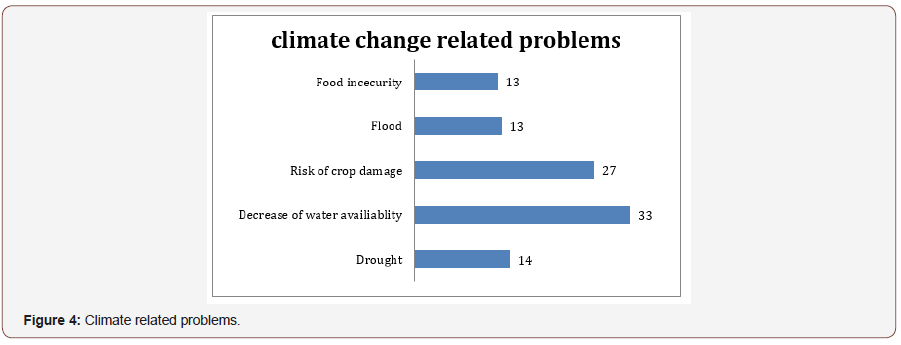
As we show the above figure, 33% of the respondent were answered decrease of water availability is the most severe problem, which followed by the decreasing or risk of crop damage as identified by 27% of the respondents. In addition to this drought and flood are on other climate related problems indicated by 14% and 13% of the respondents respectively. By following this, there is also Food insecurity problem indicated as concentrated problem by 13% of the respondents.
Barriers to climate change adaptation strategies
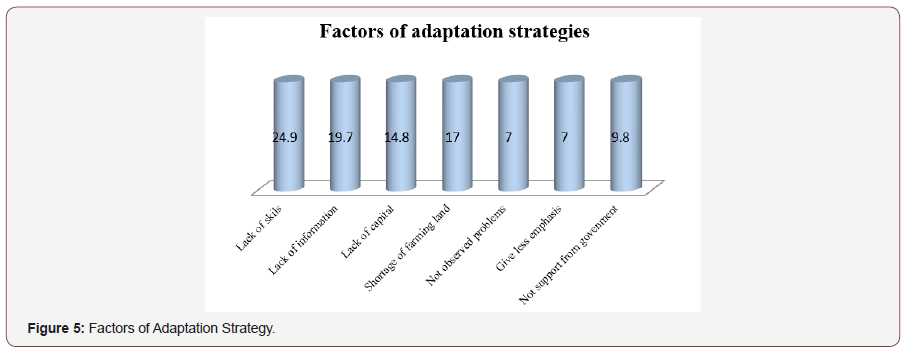
The response of the farmers why they don’t take any measure which could help to reduce the severity of climate change is discussed here with help of the following graph (Figure 5). Lack of knowledge was a major factor answered by the respondents who did not yet take adaptation measures. Lack of information is also the second barrier accordingly, problem accounts for 19.7% of reason for not taking adaptation strategies. Lack of capital, shortage of farming land, not support from government, not observed problems and give less emphasis were also mentioned as barriers to climate change adaptation based on their proportion in Estie Woreda.
Trend analyses of temperature and rainfall by using Mann-Kendall test in the study area
The non-parametric test, Mann Kendall method was used to analyze if there is a monotonic increased or decreased trend of the variable of notice over time. Mekane-eyesus meteorological station found under class three type of station, which records only temperature and precipitation and is located in Estie woreda, 11 °N, latitude and 38 °E with 2374m of elevation above sea level. Climatic raw data in this station is not enough for climate trend analysis because it contains only the year from 1996-2017. Therefor the researcher was use knmi climate explore satellite raw data.
Monthly and annually Mann-Kendall results of maximum and minimum Temperature for the area
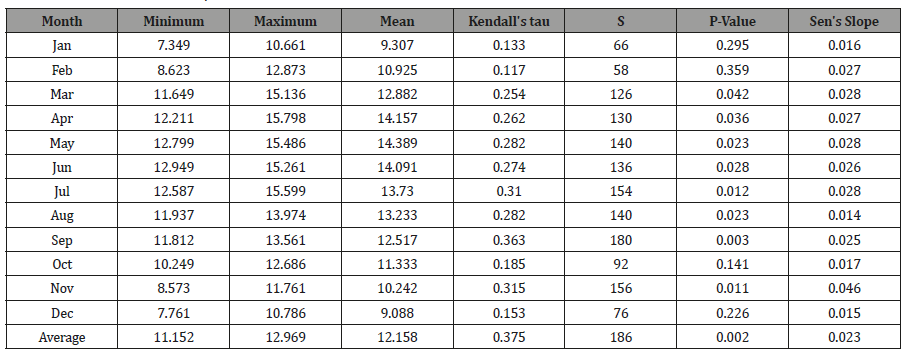
(Table 3) (Table 4) The slope of the whole months and annual maximum and minimum temperature indicates that a positive value monthly and annually temperature. The mean, minimum and maximum temperature has recorded in all months. In trend of maximum temperature except the month November which, has not a significant increase, there is statistically a significant increased trend in temperature the minimum. The study of data period 1994- 2005 shows sharp decrease in trend in the month of August at 0.05 and 0.10 levels of significance and the magnitude is also high as can be seen from the Sen’s slope estimator for the Dharamshala region.
Table 3:Kendals Maximum Temperature.
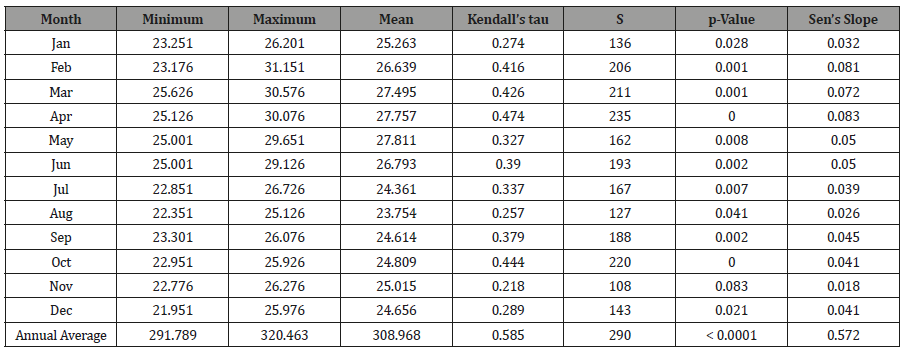
Table 4:Kendall’s Minimum Temperature.
Mann Kendall monthly and annually precipitation analysis the study area (1981-2013): In order to get the related and relevant data with ground data, the researcher was taken GPCC and CRU satellite data on knmi’s climate explore website then after, done Pearson’s correlation matrix to take similar data with ground climatic data (Table 5) (Table 6).
Table 5:Correlation Matrix.

Table 6:P Values the Data.

Table 7:Mann-Kendall Test Result for Precipitation.
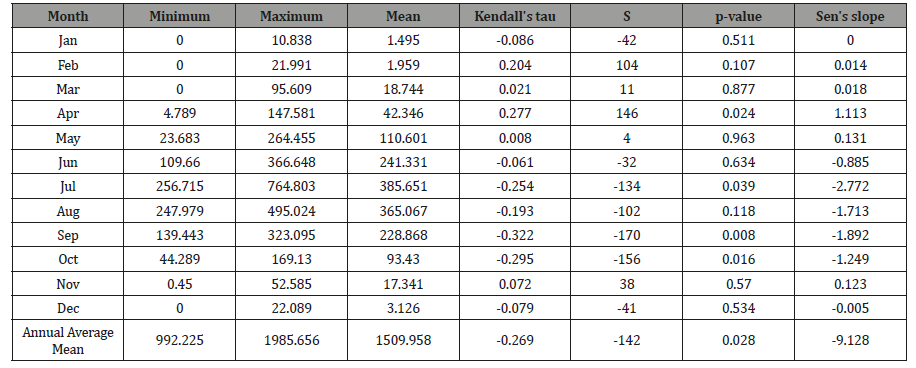
Above tables shows the correlation with p- value of GPCC raw data is the best one for trend analyses (Table 7).
The results of Mann-Kendall test for monthly precipitation data shows that there is a significant decrease in trend for the month of July, September and October in the area. While, there is significant increase in trend for the month April. Similarly, there is not a significantly increase for month February, March, May and November with Sne’s slope positive and the month Jun, August and December shows that not significant decrease trend. On the other hand, there is a significant decreased annual average mean precipitation in period. In general, the result man-Kendall trend test shows there is slightly decline precipitation in the study area. Mann-Kendall test results show that there is slightly decrease in rainfall and increased in both maximum and minimum temperature in a period. Therefor implementation of adaptation strategies has been required to response the impact of climate change in Estie woreda.
Estimated results of the multinomial logistic regression model
(Table 8)
Number of obs = 164
LR chi2 (56) = 159.01
Prob > chi2 = 0.0000
Prob > chi2 = 0.0000
Pseudo R2 = 0.3061
Table 8:Summery Statistics for Independent Variable.
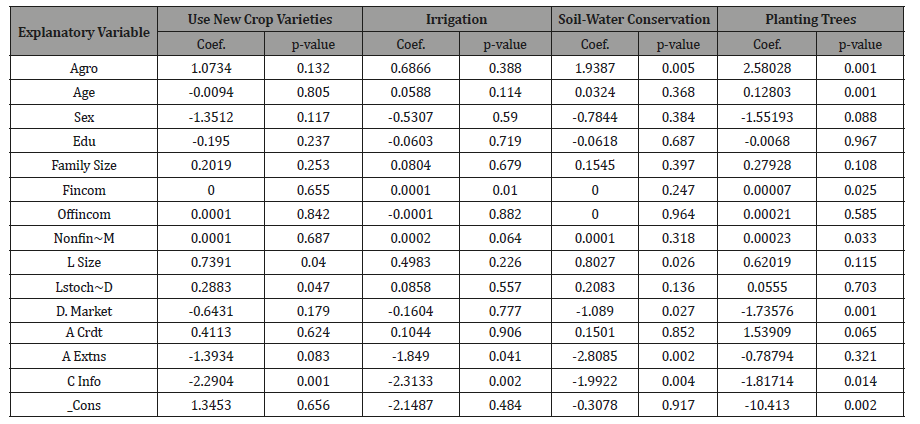
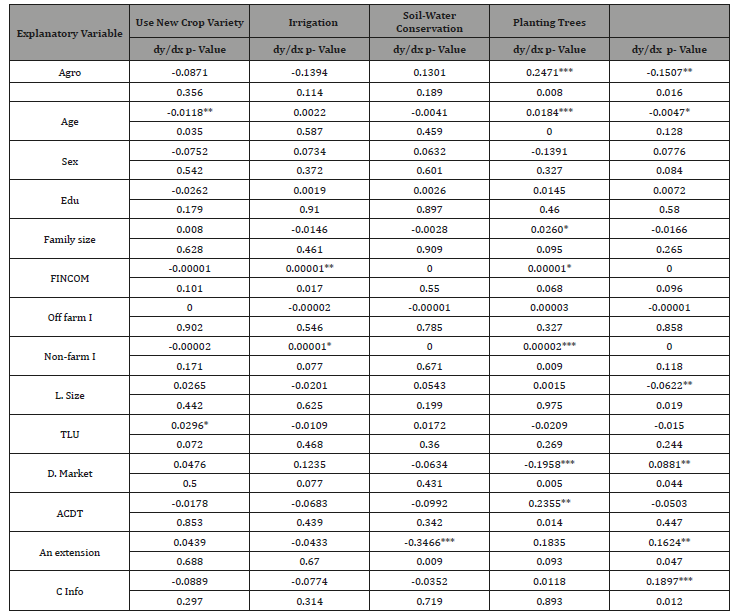
The results of Multinomial logistic model tell as how factors are influence farmers’ choice of adaptation choice in Estie woreda. In all cases, the estimated coefficients should be compared with the base category of no adaptation. Coefficient estimations from the multinomial logistic model can tell only about the direction effect but not the magnitude of effect. To compute the magnitude of effect the researcher was used stata command mfx2 after multinomial logistic regression and it shows marginal effect (Table 9).
Table 9:Marginal Effects Explanatory Variable from The Multinomial Logistic Climate Change Adaptation Model.
The Determinants of Farmers Choice of Adaptation Methods
Agro ecology
The result obtained from the multinomial logistic Model indicated that farming in Weynadega significantly increased the probability of planting different tree species as adaptation choices to climate change by 24.71% at 1% significant level as compared to other ecological zones. This result shows farmers who levies in different agro ecological zone has different adaptation options to compact climate change impacts. This result is similar with the finding of [13-15].
Age of HH
Age of HH is one of statistically significant explanatory variable which is considered as a substitution indicator for farming experience, has a positive coefficient. Positive sign indicates that it has appositive influence in taking adaptation strategy to climate change. For example, a one-year increase in age of the household head, the possibility of farmers’ planting different trees adaptation strategy is increases by 1.84%, keeping other variables are constant. On the other hand, a one year increased in age of the farmer, the probability of farmer’s not to use adaptation strategies to climate change decreased by 0.47% at 10% of significant level others are at exist. This result also supported by the finding of [16].
Family size of HH
Family size of HH is also a statistically significant explanatory variable in this model. That means farmers’ adaptation strategy to climate change is also significantly affected by the number of family size. Large number of active household members had increased adaptation decisions mechanism to reduced climate impact. A one unit increase in the member of family resulted in a 2.6% increase in the probability of farmers planting tree species at 10% significant level, holding another variable constant. This result in line with the findings of [17,18].
Farm income of HH
The result of the analysis reveals that farm income of a household had a positive and significant impact on using irrigation system and planting trees. One unit (ETB) increase in the farm income of the household probabilities increased by 0.001% of used irrigation management, planting trees at 5% and 10% significant level respectively, keeping other variables constant. When the main source of income in farming would be increase, farmers incline to participate on productivity smoothing options such as improved using irrigation system and plant
Non-farm income
Non-farm income is one variable had a positive and significant influence in adopting climate change adaptation choices. One unit (ETB) increase in the farm income of the household probabilities increased by 0.001% of improved irrigation management at 10% 0f significant level and also increased by 0.002 per cent of the probability of planting trees at 1% significant level to reduce the impact of climate change, holding other things at their respective mean. This finding shows that farmers, who had generated nonfarm income would increase the farming activities by improve the ability to purchase different climate tolerant crops, improved to use new technology. This result is consistent with studies of [20,22].
Land size of HH
Amount of farmer’s land size is also significantly and negatively affecting these farmers who are not use an adaptation method to climatic change. One hectare increases in the farm size, the probability of the farmers does not use adaptation option to climate change decreased by -6.22% at 5% level of significance, keeping other variables constant. This implies that farmers had small amount of farming land size are more likely not take any adaptation decisions because they have not more capital and resources to implement new agricultural technology [12]. Ajibefun [23], Tessema [24] were point out households with relatively large farm size were more likely to take up new adaptation strategies when compared to farmers with small farm size.
Livestock numbers of HH
Livestock numbers of HH is also another statistically significant explanatory variable in this model. It has positive and significant impact on the probability of using improved new crop variety as adaptation strategies. A unit increase in the number of livestock owned by the household from its mean value increases the probability of improving use new crop varieties by 2.96% at 10 % level of significant, holding other things at their respective mean. In this case livestock is considered as a source of income for the farmers in order to purchase improved crop variety and by providing power (like oxen, horse etc.) and their manure essential for soil fertility maintenance. Similarly [19,25-27], concluded that farmers who have large amount of livestock number of households increases significantly the ability and choice of climate change adaptation strategies.
Distance from the market center
Distance from the market center is also significantly and negatively related to planting tree adaptation option and on the other hand it is the positive influence these farmers who are not use an adaptation option to climate change. According to [12] market is an important determinant factor of adaptation method because it is one way of exchanging information with other farmers. This finding shows that a one hour increase in average time taken to the market center, the probability of farmer’s use planting tree to climate change decrease by 19.58% at 1% significant level. Similarly, a one hour increase in average time taken to the market center the probability of farmer’s not to use adaptation strategies to climate change increase by 8.81% at 5% significance level, keeping another variable as constant. Because if farmers are lived far away from the market center, they would not obtain better information, experience sharing, and it is difficult farmers to buy new agricultural technologies and inputs. This result similarly with the finding of [12,28].
Access to credit
Access to credit service also plays a positive role for farmers who are using planting trees to adopt climate change adaptation options [29-30]. It is positively affecting the adaptation decision hence it has a positive coefficient. As compared to the farmer who has no access to credit, the probability of using planting trees adaptation strategy to climate change strategies to climate change for the farmer who has credit access increases by 23.55% holding other things at their respective mean [30-35].
Access to extension service
It has negative and significant effect on soil- water conservation techniques at 1% significant level. However, it has positive and significant impact on farmers who has no access to extension service at 5% significant level. This implies that farmers could not have access to extension service, which is a means of improving their skills, the probability of using soil-water conservation practice is decrease by 34.66% at 1% significant level, on the other hand, the probability of farmers are not implement any adaptation method to climate change increase by 16.24% at 5% level of significant. Agricultural extension service is main source of information concerning agricultural activities and natural resource conservation for the farming households [35-40].
Access to climate information
Getting information about seasonal forecasts and climate change is another explanatory variable. the result show that the probability of farmers’ no to use any adaptation strategy increased by 18.97% as compared to farmers’ getting climatic information keeping other variables are at exist. Implies that farmers who had no climatic information they may be could not take any adaptation measurements [41-45].
Conclusion
In the study area indicators of climate change and variability have been observed such as off seasonal rainfall, heavy rain, little rainfall, high temperature, coolness and strong winds. Following this climate related problem have been occurred like risk of crop damage, reducing of water availability, flood and draught as well as food insecurity. The researcher can be conclude that most smallholder farmers were used at least one adaptation mechanisms based on the respondents answered because around 74.8% of the respondents have taken adaptation strategies to adapt climate change impact.in response to climate change , planting tree and soil-water conservation practice are the most practiced adaptation strategies which give priority by farmers. While, strategies such as use new crop varieties and irrigation system expressed in some proportion [46-51]. The reason why some sample respondents have not taken adaptation measures in this study area like lack of knowledge, lack of information lack of capital, shortage of farming land, not support from the government were mentioned. Multinomial logistic regression analysis was used to conclude factors that influencing farmers’ choices of adaptation strategies to climate change. The result shows that agro-ecological zone, age, distance to the market, access of extension service family size, climatic information, farm size and numbers of livestock have a significant influence on farmers’ choice of climate change adaptation strategies. On the other hand, in this finding, gender and education level of households was not being a significant influence in choice of strategies.
To read more about this article...Open access Journal of of Agriculture and Soil Science
Please follow the URL to access more information about this article
To know more about our Journals...Iris Publishers
To read more about this article...Open access Journal of of Agriculture and Soil Science
Please follow the URL to access more information about this article
To know more about our Journals...Iris Publishers
To know about Open Access Publishers


No comments:
Post a Comment