Authored by Alexandre Likoko B*,
Introduction
Global average temperature increase of 0.6°C has changed world environment. In Yangambi, temperature being increased to 0.44°C has yielded disturbed cultural calendar related to decreased crop production, and destroyed vegetations and soils. To lighten peasant farmer, land user and scientist, climatic change on annual and monthly regimes has been studied [1].
Study Field Location
Yangambi forest region (figure 1) is located at 0°49’N, 24° 29’E and 470 meters of altitude on sandy-clay to clayey-sand oxisoil textural and structural catena, vegetated by the pristine evergreen ombrophilous dense forest of Brachystezia laurentii, and semi deciduous forest of Scorodophloeus zenkeri, Pericopsis elata and Gilbertiodendron dewevrei in the central African depression of the DR Congo. Yangambi accounts for 76000 inhabitants. The warm and humid climate of Yangambi is characterized by double periodicity monthly rainfall regime with the annual means of 1822.19±214,8 mm with 172.24±21.90 rainy days, 1132.16±54.43 mm of PET, 87.17±6.97 % of relative air humidity, 2020±98.17 hours of sunshine and the average temperature of 24.98 °C [2].

Methods
Means values of rainfall (mm), number of rainy days (RDN), relative air humidity (RH, %), potential evapotranspiration (PET, mm), sunshine (hours) and average temperatures (°C) registered from 1931-2018 at the Km 5 climatology experimental station of INERA Yangambi, were computed with Excel and R 3.4 logiciel to find the independence and non stationary by the test of Wald Wolfowitz, the trends variations by the test of Mann Kendall, the significance of the climatic change rupture point at time K detected by the test of Pettit. Following Croxston and Cowden model, serial monthly rainfall original data are considered as the expression of the produced relation T X S X C X I = 0, where T= secular trend, S=seasonal variations, C=cyclical movement and I=irregular fluctuations, from which equation the monthly seasonal rainfall indexes (RSI) were calculated by regression to find significant monthly polynomial trends change from 1931 to 2018 [1,2]. Agricultural periods were determined following frequential graphic method of probable rainfall intersected with PET and PET/2 having established intersections called climatic events projected on abscissa which have constituted agronomic scale. Rainfall frequencies were calculated following Markov chains method in terms of probabilities in percentage of two consecutive humid decades obtained from the normal of rainfall from 1950 to 2010 (means of two normal’s 1950 to 1980 and 1981 to 2010). Humidity being defined by the rainfall metry as superior to 30 mm.
Results
The results of the rupture change points of climatic elements have been shown on the following figures 2-7.


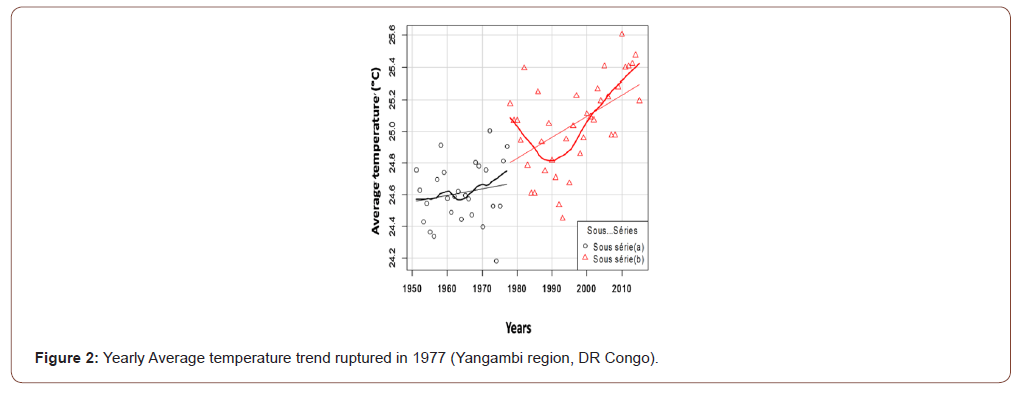
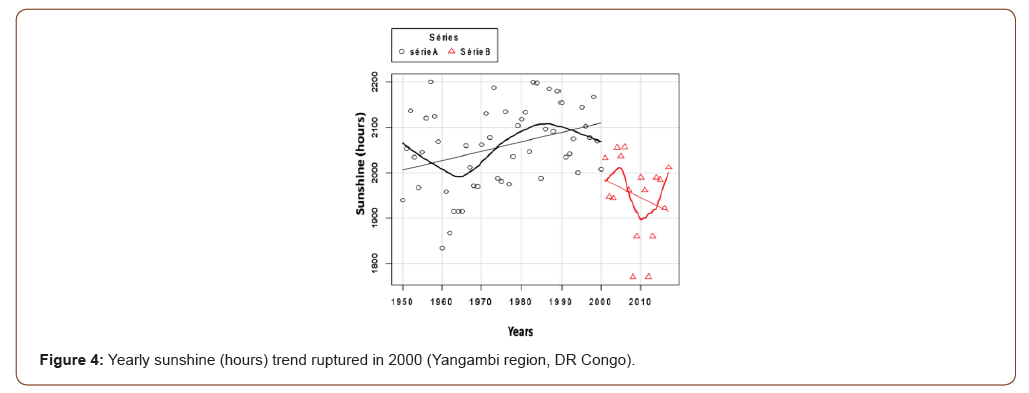
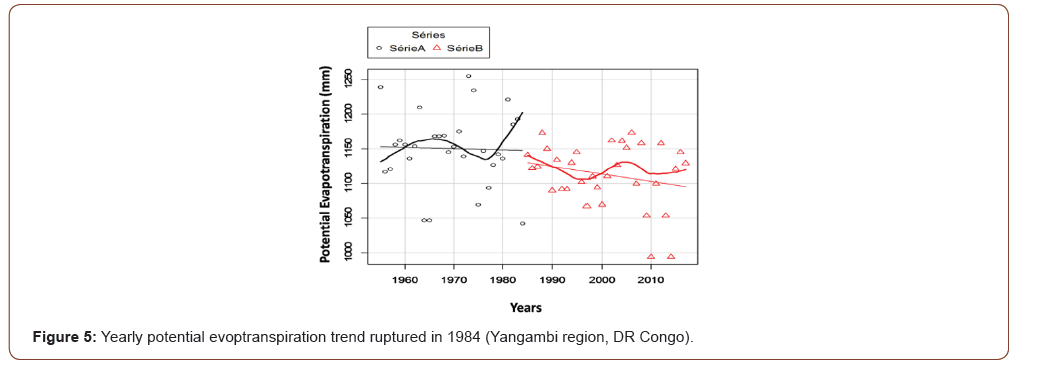
The average temperature trend change detected in 1977 was highly significant (p<0,001) of 0.44°C increase (figure 2) which has been significantly (r= -0.333) related to highly significant change RH decrease of -1.35% since 1975 (figure 3). The annual influence of temperatures on rains, RDN and PET have not been significant. But their decreasing trend change were detected with significant decrease of -107.16 mm sunshine since 2000 (figure 4), decrease of -37.31 mm PET since 1984 (figure 5) and increase of 30.50 RDN since 1950 (figure 6). From figure 7, the unsignificant (p-value=1,052) annual rainfall lost of -1.753 mm has characterized since year 2000 inter-seasonal monthly trend disturbances. Four classical monthly rainfall seasons have been reduced to two new seasons. The first eco-climatic season (1©) represents the long rainy season composed of five months: June, August, September, October and November, has formed the sustainable optimal vegetative phase within the active vegetative period from mars to November. Since 2003, the principal maximum of September with RSI 155% has replaced October (Figure 7).
The second season (2©) represents the short rainy season with three months: March, April and May. June has suffered of a directional change exponentially inflexed at RSI 110% (121 mm rainfall) in doubling the amplitude of the season from RSI 7 to 14 %, having left the short dry season. The third season (3©), the short dry season is constituted by the exponential downing month of July with RSI 65% in year 2000, which becomes the only month indecisively dry of the season representing the secondary ecoclimatic depression with more than 100 mm (145 mm) rainfall. From 2012, the seasons (1©), (2©) and (3©) are fashioned into one humid period, March to November. The fourth season (4©) represents the long dry season with December, January and February in Yangambi. From 2003, December with 143 mm, has the highest exponential decreased trend RSI from 60 to 35%, and has represented the probable driest month replacing rainfall depressions of January and February.
Cultural calendar could be reviewed
Begin sowing in the third decade of March for less water demanding crops and the second decade of August for all vegetative crop cycles. The unique annual humid season, March to November, has represented agricultural periods as followed : -soil cultivation period: 5-25 January ; -Pre-humid periods : 25january - 15march and 18june - 28june ; -Humid periods : 15march - 28may and 28june - 7december ; -Very Humid period (optimal active vegetative period) : second decade of August – third decade of November ; -Post-humid periods : 28may - 13june and 7december - 5january ; -Usable water reserve utilization period: 7december - 25january and 13june -18june.
Conclusion
The stationary annual rainfall with highly significant temperature increase has impacted on monthly rainfall seasonal indexes yielding trend disturbances since year 2000. In Yangambi, the climatic changes (but not climate change) occurred with temperature increase in 1977, relative air humidity decrease in 1975, rainy days increase in 1950, PET decrease in 1984 and sunshine decrease in 2000, are still persistently included in the bimodal regime of warm and humid tropical climate classification of Köppen, favorable to agriculture and livestock. Probable sowing commencements are dated on from the third decade of march for less water demanding crops of less than 90 days vegetative cycle and the second decade of august for all crops and forest trees [1,2]. One recommends to elucidate more about extending results to users, evaluating the climatic water balance for soil series of the catena of Yangambi, studying the agro economic impact of climatic disturbances on soil fertility of Yangambi, estimating the Yangambi biosphere reserve aboveground and undergroud carbon stock and studying hydrographic richness impacts on global hit.
To read more about this article...Open access Journal of Oceanography & Marine Biology
Please follow the URL to access more information about this article
To know more about our Journals...Iris Publishers
To know about Open Access Publishers


No comments:
Post a Comment