Authored by Tania Leme da Rocha Martinez*,
Abstract
The COVID 19 pandemic still keeps investigators, public health representatives and patients in a state of extreme worry all around the world. Investigations of the hazardous influences played by the comorbidities have to be carried on with more details than ever opening new avenues for it’s’ understanding. In this paper there was a clear statistical response for worse in the lipids and lipoprotein profiles starting from the prepandemic to the pandemic, both asymptomatic groups, maintaining the worsening in the very severely affected that had to be admitted to the Intensive Care Units, analyzing the use of hypolipidemic medications as well. The modern use of encrypted emails sending with confidentiality all the results to one specific software center enables the investigators to carry on a research with a certain similarity to a national survey. The means of all lipid analytes were significantly different between the pre and post-pandemic cohorts (2018+2019 and 2020). It also shows that the frequency of participants with altered results for total cholesterol, triglycerides, and HDL-c and with dyslipidemia were also significantly different between the two cohorts. The year of 2020 had a higher mean of lipid analytes than the pre-pandemic years of 2018 and 2019 combined. The frequencies of participants with total cholesterol above 190 mg/dL and triglycerides above 175 mg/dL were both higher in 2020 than 2018 and 2019, and the frequency of those with dyslipidemia was also significantly greater for that cohort. Besides all the medical information for each of the patients this database in full can be used for public health policies.
Keywords:19; Total Cholesterol; LDL Cholesterol; HDL Cholesterol; VLDL Cholesterol; Non HDL Cholesterol; Pandemic changes; Pre pandemic
Abbreviations:HDL: High Density Lipoprotein; HDL-c: HDL Cholesterol; LDL: Low Density Lipoprotein; POCT: Point-of-Care testing; TG: Triglycerides; VLDL: Very Low Density Lipoprotein
Introduction
In a recently accepted communication to the European Atherosclerosis Society [1] we presented the information of cardiovascular risk factors themselves in patients admitted to the Intensive Care Unit and on Hemodialysis with a main focus on the presence of dyslipidemias, while contributing to the severity of COVID 19 patient’s evolution. In this paper we demonstrate the state of the matter highlighting the lipoprotein profiles pre and post the pandemic in groups from all over Brazil, not disregarding the presence of the main modifiable risk factors. Adjourning the public health condition, the comparison was completed with the profiles of the same COVID 19 patients. The consequence of having all the comorbidities listed gives us the reason why so importantly patients are not being diagnosed in their heart conditions; either being afraid of contagiousness in health facilities or unfortunate lack of condition to be assisted. In order to demonstrate this situation in a scientific scenario this article was planned and executed.
Method
In this study, 4767 blood samples were collected from patients over twenty years (age between 20-93 years) in the Brazilian health care service. The patients, who went spontaneously to the collection points, totaled 2501 between March 2018 and November 2019 (prior to the COVID19 pandemic) and 2266 in the year 2020 (during the COVID19 pandemic). The number of service providers involved was 370 (6 patients per unit) between 2018 and 2019, and 513 (4 patients per unit) in 2020. The lipid profile test was performed on the Point-of-Care testing (POCT) platform, using a colorimetric test strip and the result is obtained in a few minutes. The POCT equipment Hilab (Hitechnologies, Curitiba/PR) uses internet Of Things (iOT) technology, which recognizes the unique QR code and sends the reaction information via cloud to the company’s laboratory in Curitiba, where a trained professional validates the reaction. The analysis of the reaction that arrives, regardless of the collection location, will ensure the absence of interferences to issue the signed report to those who made the registration and sample collection, at the health care service location, as well as to the patient’s smartphone, in up to 10 min.
From each outpatient presenting at the health service location, forty microliters (40 μl) of whole blood fingerstick sample were collected in capillary pipette, according to the instructions to avoid pre-analytical interference. The Hilab equipment uses PTS Diagnostics lipid panel test strips that employs dry-chemical testing for measurement of total cholesterol, cholesterol from High Density Lipoprotein (HDL-C) and triglycerides (TG) in whole blood. Initially, a membrane removes the red blood cells, and via horizontal flow the test strip analyzes plasma lipid concentrations. Total cholesterol and HDL-C use the same enzymatic reaction for the evaluations. The HDL lipoproteins are separated from lipoproteins Low Density Lipoprotein (LDL) and Very Low Density Lipoprotein (VLDL) using phosphotungstic acid and a magnesium salt layer above the membrane fractionation layer. The resulting HDL fraction in plasma reacts with surfactants and enzymes for measuring cholesterol concentration. The linear range in this lipid panel test strip are in mg/dL: total cholesterol >120 and <400, HDL-C >20 and <100, TG >120 and <400. LDL Cholesterol (LDL-C) values were obtained by calculating Martin’s formula (Fried Ewald’s formula modification) and non-HDL-C values by subtracting the HDL-C value from cholesterol total value. The evaluation of TG is carried out by a colorimetric enzymatic method using lipoprotein lipase, glycerol kinase, glycerol phosphate oxidase and peroxidase [2-12]. The Hilab equipment employs reflectance photometry.
We worked with a retrospective database from March 2018 to December 2020. The results of the lipid profile are reported in mg/dL. The system of information exchange is encrypted in several layers. Personal information is dissociated from the results (different databases), making breach of confidentiality extremely difficult. Statistical tests were applied in various comparisons: chi square test, student t test and ANOVA test.
Result
In the total sample, there was a significant difference of means of all lipid analytes between the different age groups and between the different Brazilian geographical regions (Table 1 & Table 4). Participants between the ages of 40 and 59 years old presented the highest levels of all analytes and the lowest levels of HDLcholesterol. Participants residing in the North region presented with the highest total cholesterol and LDL-c means, closely followed by the Northeast (Table 2). Those in the Northeast also presented with the highest mean of TG levels. There was a significant difference in the means of TG and HDL-c between those who identified as smokers and those who did not. Smokers presented higher TG mean and lower HDL-c mean (Table 3 & Table 4). The means of total cholesterol, TG and HDL-c were all significantly different between males and females (Table 4). Table 8 shows that the means of all lipid analytes were significantly different between the pre and postpandemic cohorts (2018+2019 and 2020). It also shows that the frequency of participants with altered results for total cholesterol, TG and HDL-c and with dyslipidemia were significantly different between the two cohorts. The year of 2020 had a higher mean of lipid analytes than the pre-pandemic years of 2018 and 2019 combined (Figure 1 & Figure 2).
Table 1: Number of participants (N) per year and per valid ranges.

Table 1: Number of participants (N) outside the range of the test.

Table 3: Distribution of participants by demographic characteristics and cohort - 2018 + 2019 and 2020.
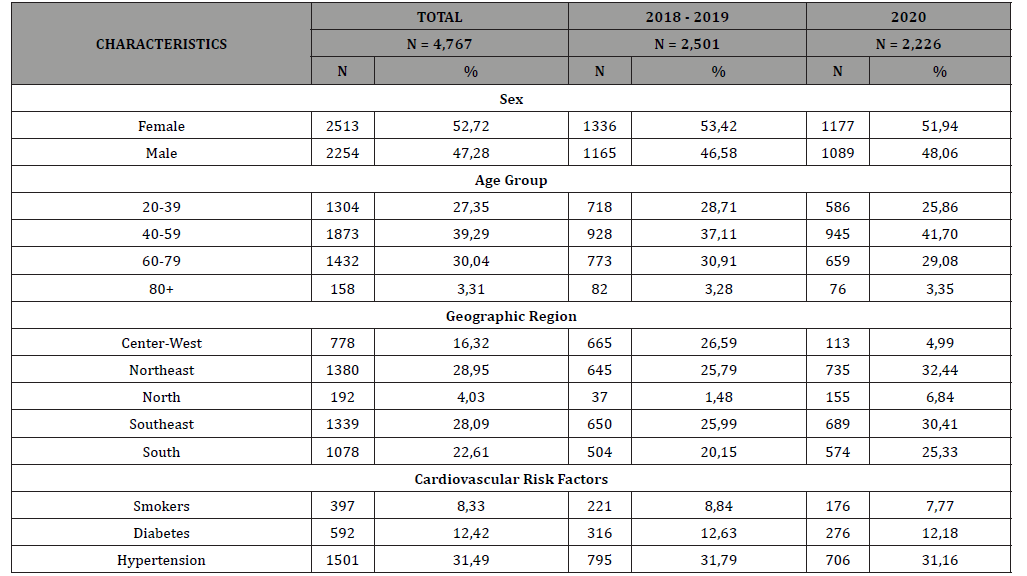
Table 4: Mean and standard deviation of lipid analytes’ values by demographic characteristic of participants.
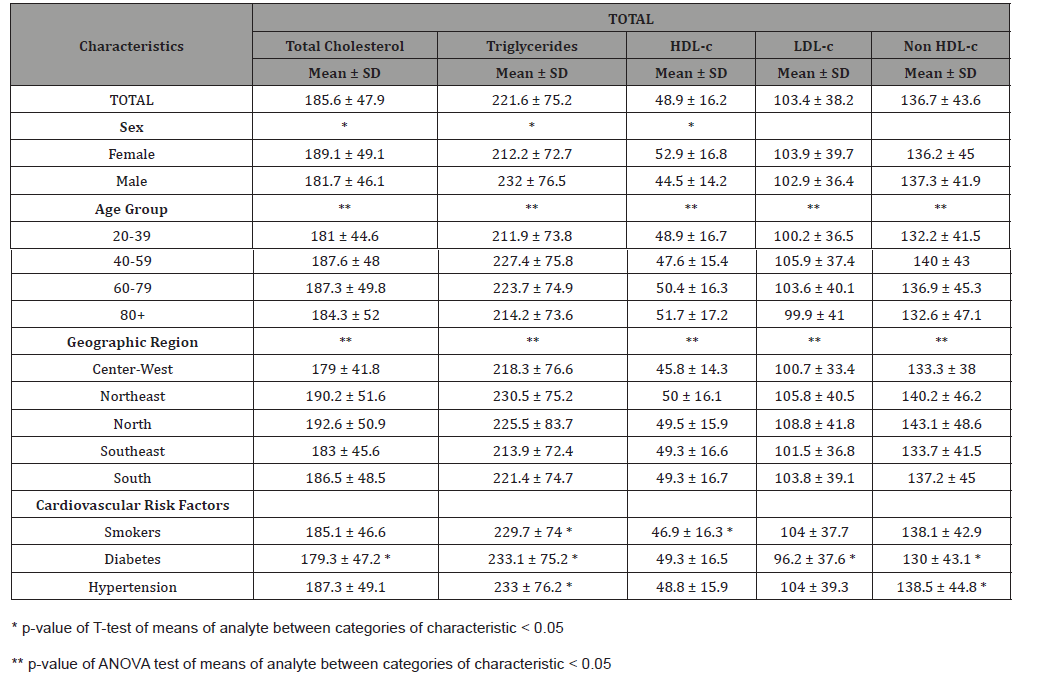
Table 5: Mean and standard deviation of lipid analytes’ values by demographic characteristic of participants by cohort - 2018+2019.
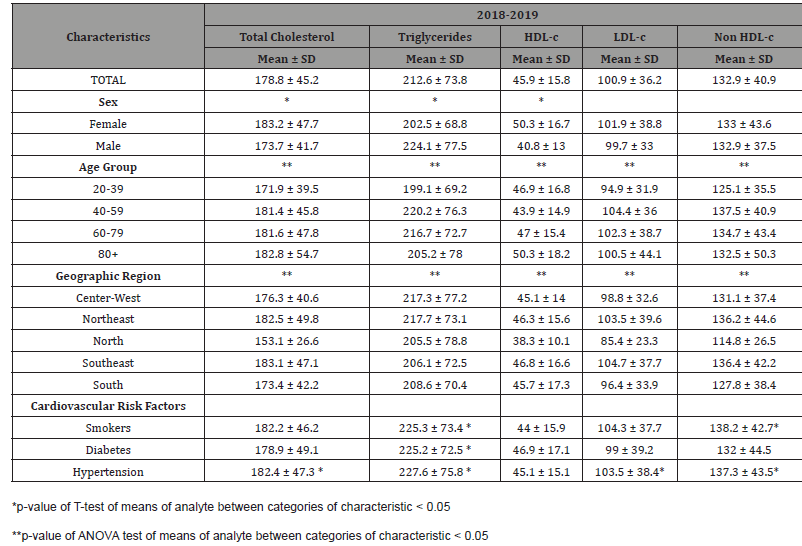
Table 6: Mean and standard deviation of lipid analytes’ values by demographic characteristic of participants by cohort - 2020.
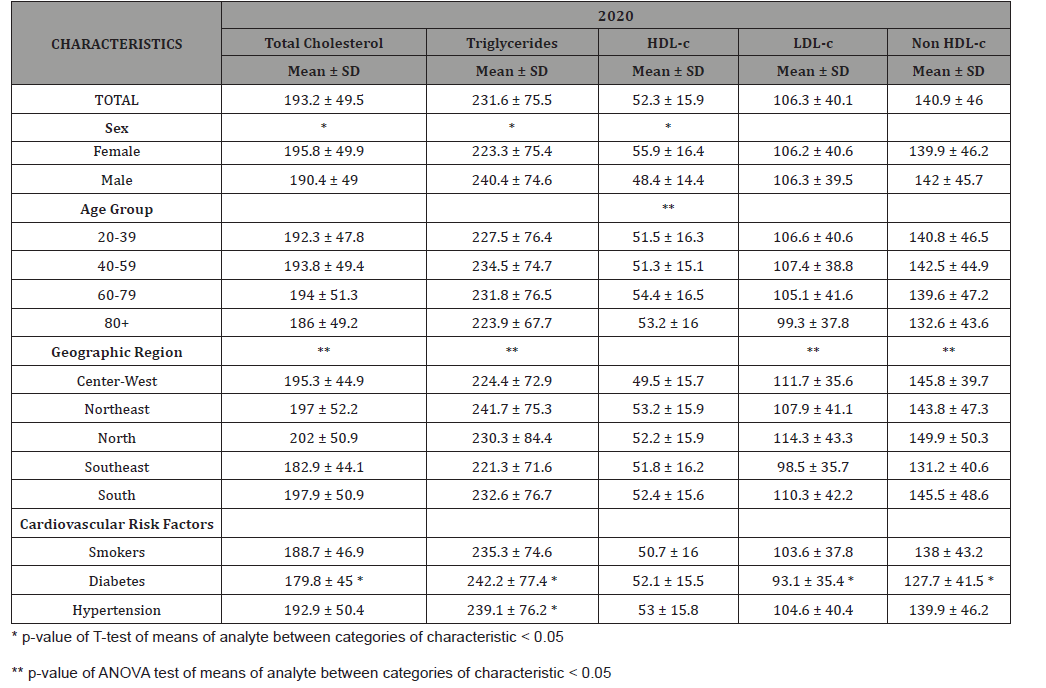
Table 7: Percentage and confidence interval of altered results of total cholesterol, triglycerides, HDL-c and dyslipidemia per demographic characteristic of population.
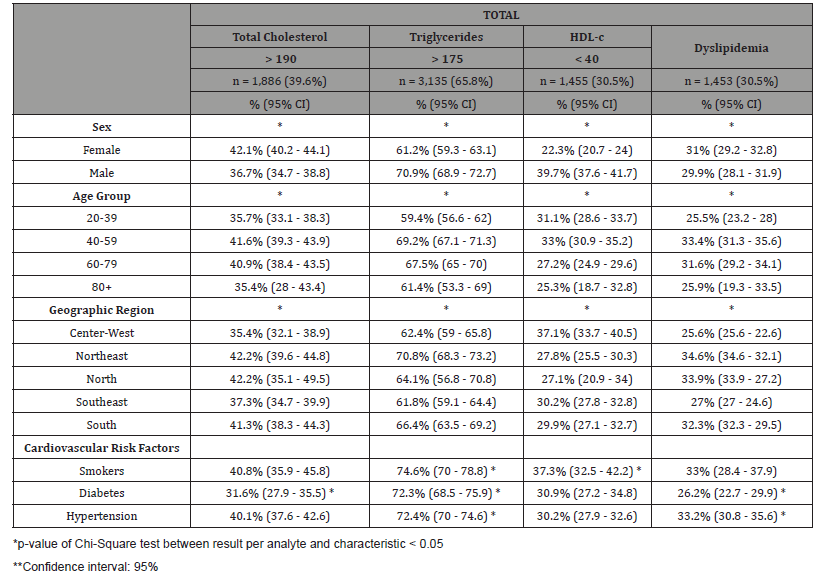
Table 8: Percentage and confidence interval of altered results of total cholesterol, triglycerides, HDL-c and dyslipidemia per demographic characteristic of population per cohort - 2018+2019.
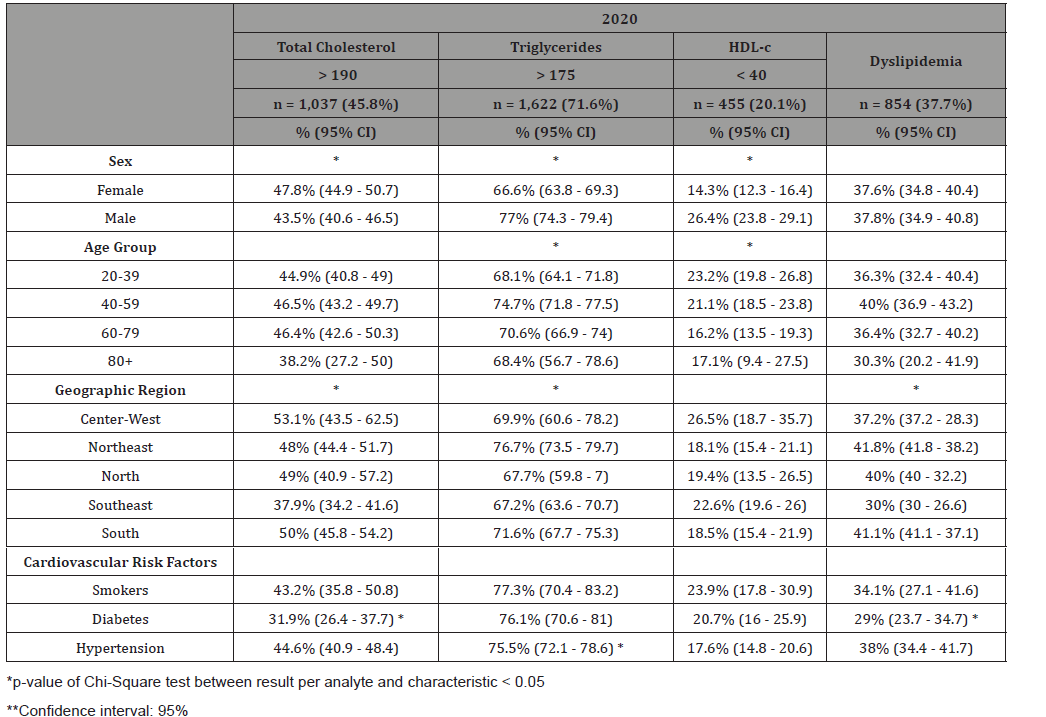
Table 10: Percentage and confidence interval of altered results of total cholesterol, triglycerides, HDL-c and dyslipidemia per demographic characteristic of population per cohort - 2020.
Table 11: Means of analytes and frequency of altered results between cohorts 2018+2019 and 2020.
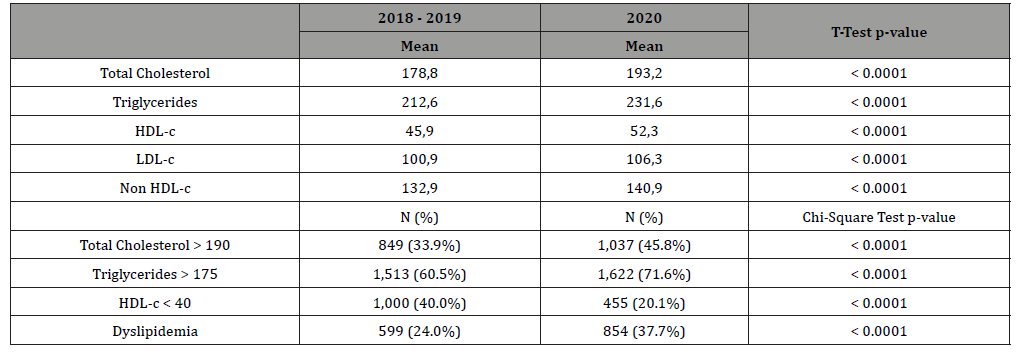
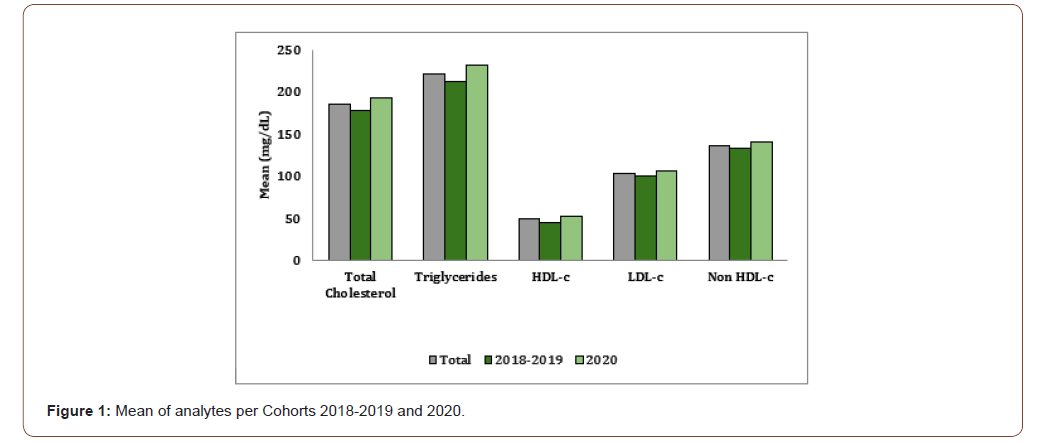

The frequencies of participants with total cholesterol above 190 mg/dL and TG above 175 mg/dL were both higher in 2020 than 2018 and 2019, and the frequency of those with dyslipidemia was also significantly greater for that cohort. For both pre-pandemic and post-pandemic cohorts, there was a significant difference in the means of males and females for total cholesterol, TG and HDL-c. But the difference seen in the total sample, between different age groups, was only true for the 2018-2019 cohorts (Table 5A). The significant difference between Brazilian geographical areas stayed true when stratified by the different cohorts, except for HDL-cholesterol in 2020 (Table 5B). In Table 6, we can see that the majority of our total sample presented with TG above 175 mg/dL (65.8%). And 39.6% had total cholesterol levels above 190 mg/dL. In general, males, more frequently than females, had altered TG and total cholesterol levels. Males were also more likely to have HDL-c levels below 40 mg/dL (Table 6). Participants between 40 and 59 years old, presented higher frequencies of altered TG and total cholesterol levels. In this group, 69.2% of participants had TG levels above 175 mg/dL and 41.6% had total cholesterol levels above 190 mg/dL (Table 6). Between the different Brazilian geographical regions, the Northeast had significantly more participants with altered TG levels. It also, along with the North, presented with the highest frequency of participants with total cholesterol above 190 mg/dL.
The percentage of participants with altered total cholesterol levels increased from 33.9% in 2018-2019 to 45.8% in 2020. That difference for altered TG levels was from 60.5% to 71.6% during the pandemic (Table 8). Even after stratification by cohort, the Northeast region of Brazil maintained the highest frequency of participants with altered TG levels. However, the Southeast presented with the highest frequency of participants with altered total cholesterol in 2018-2019 (Table 7A) and, in 2020, the highest frequency was in the Center-West region of Brazil (Table 7B).
Conclusion
As expected, there was a worsening of several situations: fewer people went to check their lipids for fear of contamination and the effect of their results for their lipids and lipoproteins profiles were all signaling the same-change for worse interplaying with the other comorbidities and leaving the patients with less chances of partial or total recovery. The COVID 19 pandemic still keeps investigators, public health representatives and patients in a state of extreme worry all around the world. Investigations of the hazardous influences played by the comorbidities have to be carried on with more details than ever opening new avenues for its’ understanding. In this paper, there was a clear statistical response for worse in the lipids and lipoprotein profiles starting from the prepandemic to the pandemic, both asymptomatic groups, maintaining the worsening in the very severely affected that had to be admitted to the Intensive Care Units, analyzing the use of hypolipidemic medications as well. Besides all the medical information for each of the patients this database in full can be used for public health policies [13-22].
To read more about this article...Open access Journal of Cardiology Research & Reports
Please follow the URL to access more information about this article


No comments:
Post a Comment