Authored by Anthony J DeArdo*,
Abstract
As the result of the need to increase fuel economy, reduce CO2 emissions and improve passenger safety, the usage of advanced high strength steels in the automotive industry has increased rapidly in the recent years. These steels are multiphase in nature, i.e., dual-phase, complex-phase, transformation induced plasticity or quench and partitioning steels, and evolve from cold rolled and inter critically annealed initial microstructures. They often exhibit low yield strength, high ratios of work hardening and high levels of ultimate tensile strength, all while maintaining reasonable values of uniform and total elongations. One drawback to these steels is their rather low level of sheared edge ductility, of which hole expansion ratio (HER) is a typical representative. The literature in HER studies has shown that single phase monolithic microstructures exhibit high HER values, especially for ferritic or bainitic microstructures. In an effort to achieve both a high strength and HER values, it has been suggested that a finegrained polygonal ferrite microstructure, further strengthened by large amounts of fine microalloyed carbides or nitrides, as might be expected in a hot rolled and coiled steel, might satisfy both goals of high strength and reasonable hole expansion performance. The goal of this current study is to critically test this hypothesis. In this current study, the relationships existing among the hot mill processing, as-coiled microstructure and mechanical properties of one highly microalloyed steel hot rolled to 3 mm and then coiled were investigated. The major alloying elements used in this steel were Mo, Ti, and V. Discrete processing parameters, i.e., finish rolling temperatures (FRT) and coiling temperatures (CT), were also applied. It was found that the FRT had only a very minor influence on either microstructures or mechanical properties. However, the CTs strongly influenced both the microstructures and mechanical properties. It was further found that despite the high level of microalloying, the strength appeared to be controlled mainly by the dislocation density of non-polygonal ferrite observed at all CTs, with a minor-to-moderate contribution from the microalloyed precipitates. With falling CT, the microstructure in the matrix was observed to change from mainly polygonal ferrite to quasi-polygonal ferrite to granular bainite and upper bainite, accompanied by the formation of martensite/austenite (M/A) constituents at the lower coiling temperatures. The strength appeared to be increased by the dislocations originating by the shear component of the displacive phase transformation, and by fine (Ti, Mo)C precipitates, both formed during the coiling process. This contrasts to the polygonal ferrite formed at high transformation temperature that are reconstructive in nature and controlled by long range diffusion. Strengths reaching values as high as 1166 MPa in yield strength and 1225 MPa in tensile strength were observed in specimens after coiling at 610°C, and the steels still had a reasonable total elongation of around 20%. However, the hole expansion ratios of these steel conditions were rather low in this study, especially for those steel conditions with higher strength. Several factors appeared to contribute to the poor hole expansion ratios found in these steel conditions: the presence of coarse TiN inclusions, a large amount of strengthening precipitates and a high dislocation density as well as the presence of M/A constituents.
Keywords: Ferritic hot band steels; Thermo-mechanical controlled processing; Precipitation hardening; Dislocation strengthening; TiN inclusions; Hole expansion
Introduction
In mass reduction programs in the automotive industry to simultaneously improve fuel efficiency, lower CO2 emissions, and strengthen the passenger crumble zone, the major focus has been the body-in-white (BIW), since this is where the highest amount of steel sheet is used. To reduce this mass, newer thinner, higher strength steels are being substituted for heavier gauge lower strength older steels. However, successful candidate steels must also have adequate levels of global formability (total elongation), local formability (sheared edge ductility), and crumble zone resistance. Popular candidate steels for the BIW include the new multiphase advanced high strength steels (AHSS): dual-phase (DP), transformation induced plasticity (TRIP), complex phase (CP) and martensitic (MART) steels, as these steels can exhibit high strength with reasonable global and local ductility [1-4]. It goes without saying that new light-gauge hot band steels must also meet these current requirements. Compared with conventional high strength low alloy (HSLA) steels [5], the AHSS steels, generally with yield strengths (YS) easily exceeding 500 MPa, can offer much higher ultimate tensile strengths (UTS) in excess of 1000 MPa [2].
Recently, a new generation of microalloyed hot band steels has been proposed and developed. The microstructural design of these steels was intended to combine high strength through ferrite grain size control and precipitation hardening, and high sheared edge ductility or hole expansion ratios [6-8] by having a monolithic ferrite matrix phase. There is a substantial literature showing that high hole expansion ratio (HER) values are often associated with spatially uniform matrix hardness, as found in monolithic microstructures, i.e., interstitial free (IF) steels, HSLA steels and bainitic steels. On the other hand, the AHSS steels rely on multi-phase microstructures for high work hardening rates required to achieve high UTS values, combining soft phases such as polygonal ferrite with hard phases such as martensite or bainite; the HER of these microstructures has been shown to be consequently inferior [9]. The new hot band steels have attempted to follow this monolithic matrix path, i.e., they all used a single phase ferrite as the matrix for superior ductility and hole expansion ratio [10,11], and fine ferrite grain size and precipitate hardening of the ferrite for the high strength.
For example, one approach involved precipitation strengthening with nano-sized (Ti, Mo)C precipitates in fine-grained ferritic matrix [12]. It was claimed that this steel can reach a UTS of 805 MPa, with 20% total elongation (TE) and 100% HER. More recently, another version of a similar steel was introduced, first in Asia [13], then later in Europe [14]. These new steels also had a fine-grained ferrite matrix and exhibited UTS levels over 950 MPa caused by the combination of grain refined ferrite and the presence of nano- sized precipitates containing Mo, Nb and V [14]. These steels were produced as hot band coils with a gauge thickness from 3 to 4 mm through conventional processing. According to recent fracture toughness testing, DP steels of similar strength ranges required at least 6 mm of thickness to achieve plane strain test conditions [15]. Since the 3 mm thickness of the current study places the steels in the plane stress condition, leading to artificially high K1C values, both fracture toughness and Charpy impact toughness considerations were not thought to be a major concern.
In this present study, a similar experimental design philosophy, i.e. using a monolithic microstructure, was applied, and the goal was to produce a hot band steel with a YS larger than 1000 MPa and a UTS in excess of 1200 MPa, also with good ductility and hole expansion ratio. The effect of thermomechanical processing for ferrite grain refinement, and the presence of microalloying elements Mo, Ti and V for precipitation were studied in a 0.14 wt.% C - 1.35 Mn carbon steel. To alter the ferrite grain size and microstructures, the steels were produced with different finish rolling temperatures (FRT) and coiling temperatures (CT). The effect of processing parameters on the formation of microstructures was explored and the observed microstructures were correlated to the mechanical properties.
Experimental Procedure
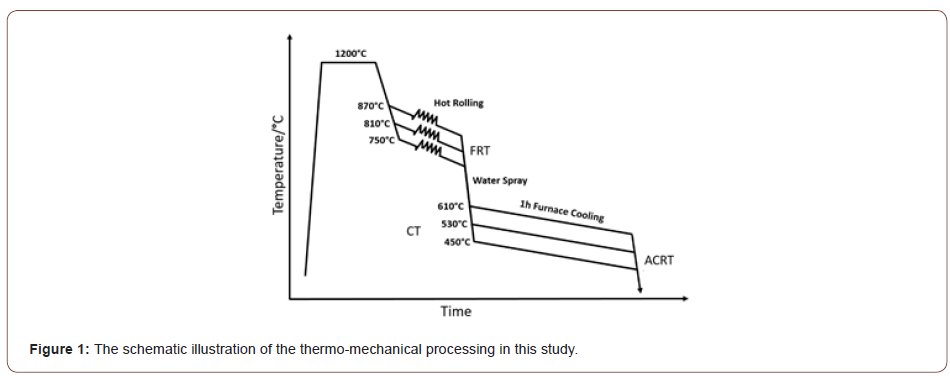
The chemical composition of the steel investigated in this study is given in Table 1. The amounts of the microalloying elements in the 0.14 wt.% C steel are: 0.35 wt.% Mo, 0.294 wt.% V and 0.163 wt.% Ti. It should be noted that these represent unusually high levels of microalloying. The steel was laboratory vacuum melted then hot rolled to 3 mm in two stages. In the first stage, the ingots were reheated to 1200°C and then rough hot rolled to 22 mm, followed by air cooling to room temperature (ACRT). In the second stage, the 22 mm slabs were further hot rolled to 3 mm, but with different FRTs, i.e., 870°C, 810°C and 750°C. Immediately after hot rolling, the 3 mm thick steels were rapidly water spray cooled at about 30°C s-1 to coiling temperatures of 610°C, 530°C and 450°C, after which they were furnace cooled about 1 hour, followed by ACRT to the room temperature. This TMCP used is shown schematically in Figure 1.
Table 1: Chemical composition (wt.%).

The nine different steel conditions were designated as PGX1X2 where the first digit X1 represents the finish rolling temperature from high (1) to low (3), and the second digit X2 is the coiling temperature, also from high (1) to low (3). For example, the condition PG11 means the FRT is 870°C and CT is 610°C.
Concerning sample preparation, the samples were cut, mounted, ground, mechanically polished and vibratory polished with 0.5 μm alumina paste for a couple of hours to eliminate the internal plastic strains caused by mechanical grinding and polishing. They were then etched with 2% Nital reagent for the grain boundaries, and alkaline sodium picrate etch for the martensite/austenite constituent observation. The bulk microstructures were characterized with Keyence and Nikon FX-35WA optical microscopes (OM) under bright or dark field illumination for low magnification micrographs. The ZEISS Sigma 500 VP scanning electron microscope (SEM) fitted with an Oxford Aztec X-EDS were used to observe the SEM microstructures and to identify qualitatively the elemental compositions of specific inclusions and particles. Electron backscattered diffraction (EBSD) raw data were collected by using the FEI Apreo SEM fitted with an EDAX TEAM EBSD acquisition system. The experiments were conducted with 14-mm working distance, 20 KeV, 15 spot size and step sizes of either 0.2 μm or 0.1 μm, depending on the ferrite grain size or the magnification of the scanned area. The detailed crystallographic information, like grain size, grain boundary character distribution (GBCD), image quality (IQ), orientation distribution function (ODF), and kernel average misorientation (KAM) were generated and analyzed by EDAX OIM analysis software. The FEI Tecnai G2 F20 transmission electron microscope (TEM) was used for the observation of fine precipitates on carbon extraction replicas. The replicas were made using a Denton DV-502 Bell Jar Vacuum Evaporator, followed by 10% Nital etching to dissolve the matrix. The replicas were then placed on a copper grid for the TEM observations, after being dipped into a mixture of distilled water and ethanol. All samples were observed in the TEM at 200 KeV.
All the steel conditions were machined from the 3 mm thick hot bands. The Vickers hardness (VHN) values were obtained from an Intron hardness tester operating under 300gf force loading and 10s dwell time [16]. The VHN measurements were made on the surface of rolling direction (RD)×normal direction (ND). Uniaxial tensile tests, conforming to ASTM E8, were performed at room temperature, at a strain rate of 1.1×10⁻³ s-1 with an Intron Microforce Testing System (MTS). The Sub-sized tensile specimens were used in this research, with the dimension of 25 mm gauge length and 6.25 mm gauge width. The longitudinal direction of the tensile samples was along the rolling direction. The normal tensile properties were determined. In addition, hole expansion tests were conducted after hole punching at a speed of 0.3 cm min-1 with a continuously moving conical punch expanding a 10 mm diameter hole in the center of a 100 mm×100 mm sample removed from the various hot band coiled steel conditions. The initial hole was made using a high speed 10 mm diameter punch. The ID of the expanded punched hole was continuously monitored using a camera with adjustable lenses. The HER test duration was ended when a crack was observed to run through the sheet thickness. The magnitude of HER was calculated as HER=(Df-D0)/D0×100%, where D0 and Df are the initial and final hole diameters, respectively. The HER test used conforms to ISO Standard TS 16630 Technical Specification for hole expansion testing [17,18].
Results
Microstructures of the hot band coiled steels
Matrix behavior: Although the FRT did not appear to have a strong effect on the microstructure, for example at constant CT, the CT itself did have a large influence on the final microstructure. Figure 2 shows the SEM micrographs with low magnification of hot band coils after being etched by 2% Nital. In Figure 2, the steel condition sharing the same CTs seem to have similar microstructures, while the microstructures of steels with different coiling temperatures are distinctly different. Considering the final microstructures of the steel conditions with the CT of 610°C, shown in Figures 2 (a), (d) and (g) are a mixture of ferrite grains of varying shape, size and type, including what appear to be polygonal ferrite (PF), quasi- polygonal ferrite (QF) and acicular ferrite (AF). A small amount of martensite/austenite (M/A) constituents can also be observed in these steel conditions. In terms of the low temperature (i.e., 530°C or 450°C) coiled hot band steels, the ferrite grain boundaries be come more irregular, and a second but non-ferritic constituents (such as upper bainite (UB), granular bainite (GB) and M/A constituents) are also observed, Figure 2(b), (c), (e), (f), (h) and (i).
Figures 3 and 4 are SEM micrographs with different magnifications taken in the secondary electron mode following etching in 2% Nital reagent. The lowering of the CT results in the morphology change of the ferrite grains, and different phase changes also occur within the ferrite as the CT decreases. Figure 3 shows the SEM micrographs of hot band coils with a FRT of 810°C, but with varying coiling temperatures (610°C, 530°C and 450°C). Figure 3(a) with a CT of 610°C, the specimen exhibits principally a mixed microstructure of polygonal and quasi-polygonal ferrite grains. In Figure 3(b), the microstructure shows a mixture of mainly QF and GB. In addition, M/A constituents observed dispersing within the ferrite grains or on the grain boundaries are in the steel conditions with a CT of 530°. Some of the M/A is located in the bainitic ferrite, i.e., GB, while some is randomly located in or near the QF. For the steel condition with a CT of 450°C, QF, UB and a small amount of martensite appears as shown in Figure 3(c).
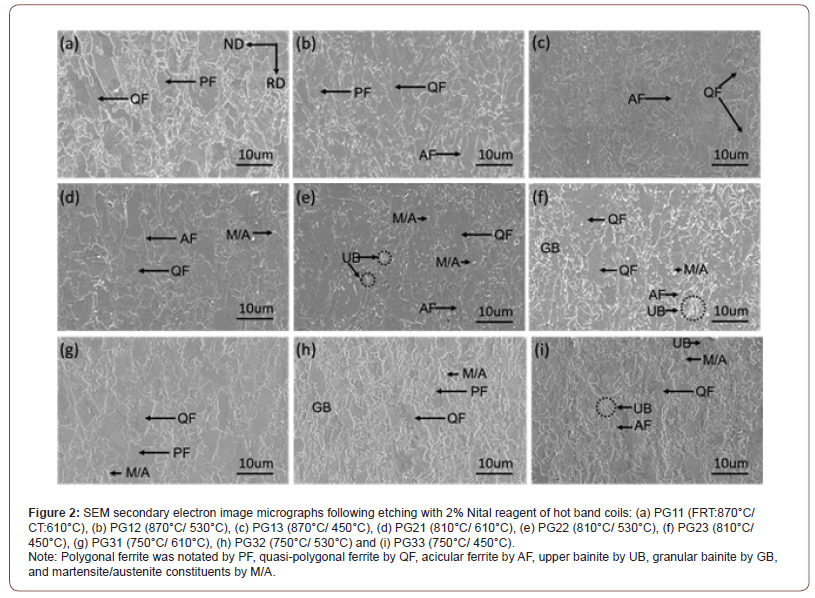


Figure 4 shows the SEM micrographs taken of the hot band coils with a lower magnification. From Figures 4(a) to 4(c), when the FRT is 750°C, the SEM micrographs of the steel coiled at 610°C show mainly polygonal ferrite with a certain amount of acicular ferrite.
However, as the coiling temperature drops to 530°C or 450°C, some course QF grains with irregular grain boundaries can be observed in the final microstructures.
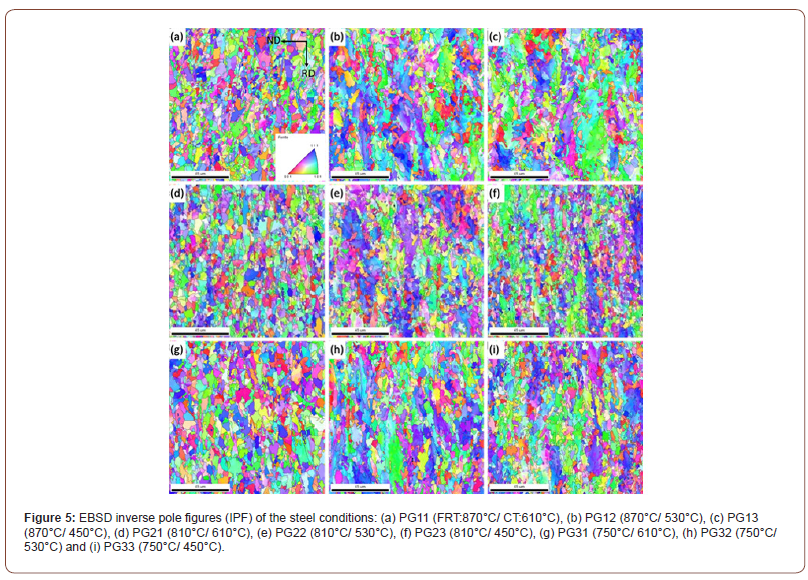
Figure 5 shows the inverse pole figures (IPF) with high angle ferrite grain boundaries (HAGB) of all the steel conditions. The IPF illustrates the positions of the crystal coordinate system with respect to the sample coordinate system. The orientation triangle shown in Figure 5(a) presents the orientation of the normal direction of the grains represented by different colors. It shows the steel conditions with a CT of 610°C have the most uniform grain sizes with a random distribution of grain crystallographic orientations. However, regarding the low temperature (i.e., 530°C or 450°C) coiled hot band steels, the coarse and elongated QF grains with a blue-purple crystallographic orientation can be clearly seen.
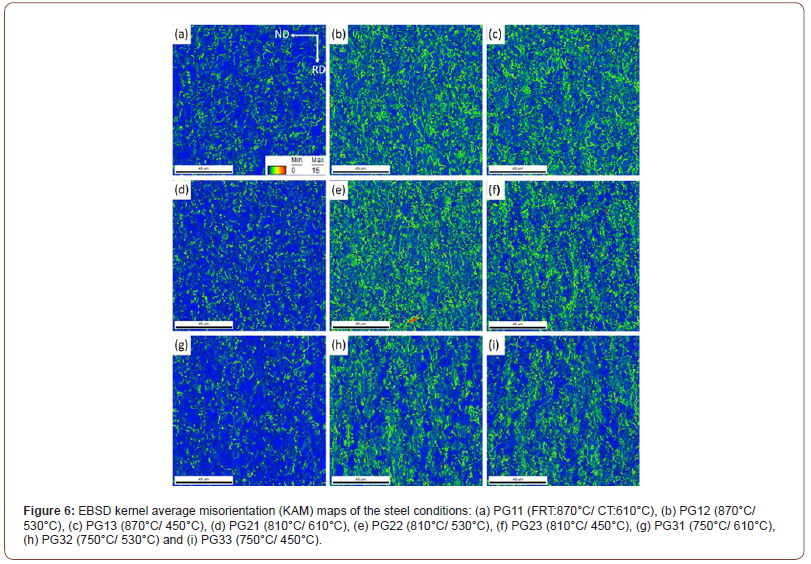
The kernel average misorientation (KAM) maps of all the steel conditions are presented in Figure 6. The KAM data was calculated using the 1st nearest neighbor kernel with a local misorientation threshold of 15°. It clearly shows the much higher percentage of sub-grain structures (green features) in the steel conditions with lower CTs. The dislocation density with the CT of 610°C showed a low but uniform level; but were higher at 530°C, and even higher at 450°C. However, the dislocation densities were uneven at 530°C and 450°C, indicating mixed microstructures. It also draws the same conclusion that the FRT does not strongly affect the microstructure.
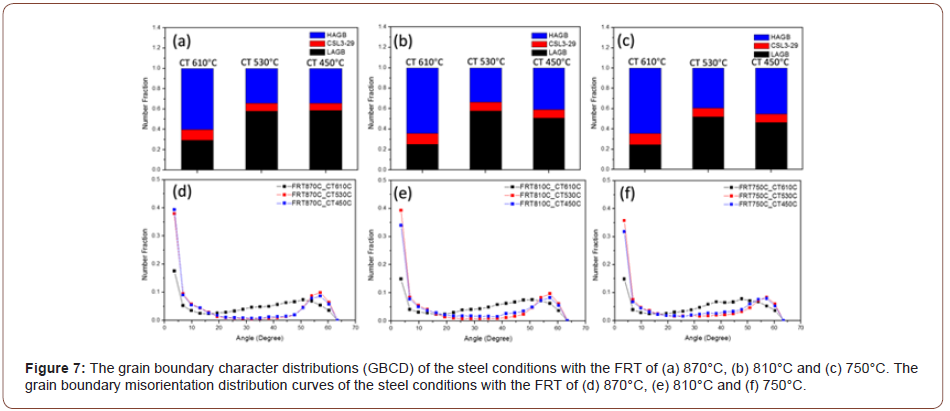
The grain boundary character distribution (GBCD) curves and misorientation curves from the EBSD results are exhibited in Figure 7. From the GBCD curves, it seems that all the steel conditions with the same coiling temperatures have similar results. With a CT of 610°C, there is a much larger fraction of high angle grain boundaries (HAGB) and a smaller fraction of low angle grain boundaries (LAGB), than observed at lower coiling temperatures. Also, the fraction of coincidence site lattice (CSL, Σ3 to 29) grain boundaries does not vary very much. It is obvious that the difference in the GBCD is related to the transformation and microstructural changes that vary with transformation or coiling temperature. The GB misorientation distributions are presented in Figures 7(d) to (f) for all the steel conditions.
Precipitation behavior: For a better observation of the M/A islands and the various carbides observed in the matrix, an electrolytic etching method was applied [19,20]. The etching was conducted in an alkaline sodium picrate solution at 6 V for 2 to 4 minutes. The ferrite matrix remained unetched, while the fine islands of bainite or carbides, were preferentially etched first and darkened quickly. As the etching continued, once the specimens were etched properly in the solution, the M/A constituents appeared as white. As shown in Figure 8, the specimens with a CT of 610°C indicate neither much bainite nor carbides nor M/A constituents in the matrix, and only the prior austenite grain boundaries appear. This CT is well above the BS temperature. However, considering the steel conditions with a lower coiling temperature, i.e., 530°C or 450°C, a large amount of bainite or carbides was observed, as well as the M/A islands. The differences between the microstructures with two lower coiling temperatures are that at the CT of 530°C, the bainite or carbides are distributed relatively uniformly and the M/A islands are fine; while at the CT of 450°C, the carbides become coarser and segregated into bands that are parallel to the rolling direction, while the M/A islands become more frequent and relatively coarser. The volume percentages and the maximum average sizes of M/A for different steel conditions are summarized in Table 2. The maximum average size of M/A particles is defined as the average size of the top 10% of the largest M/A islands in the final microstructures. From Table 2, as the coiling temperature decreases, the volume fraction of M/A constituent increases, as well as the enlarged particle size.

During the observation of the microstructure, it was found that in addition to the M/A particles, there is another type of second phase hard particles that can be observed frequently, which is the TiN particles (Figure 9). Those particles, generally with a cuboidal shape, with a size of several microns did not have any strengthening or pinning effect [21,22]. Instead, they would be very harmful to the mechanical properties, nucleating either ductile or brittle fracture, therefore, it is important to consider how to limit the Ti that has been consumed to form coarse TiN.

Table 2: The volume fractions (fV, %) and maximum average sizes (dmax, μm) of M/A particles.

During the metallurgical observation, a large amount of particles or inclusions, in addition to the TiN and M/A constituents, can be seen on the specimen’s surface. To better observe these particles, dark field optical microscopy was employed in this experiment and a typical micrograph is shown in Figure 10, where two sizes of particles can be observed. From the SEM/EDS results shown in Figure 11, the larger particles are TiN or TiN with an oxide core in the center at a size of several microns with a typical cuboidal shape. The smaller particles are MC or more likely M2C carbides of approximate composition (Ti, Mo, V)C. Since they were visible in the OM, with a resolution limit of 200-500 nm, they were assumed to be of a size of several hundreds of nanometers with a spherical shape. The surface observation of this type of carbide indicated that they were located in lines along the rolling direction. Figure 12 shows the dark field OM from steels with different finishing rolling temperatures but coiled at the same temperature of 610°C. It shows that the volume fraction of the carbides increased as the FRT decreases.

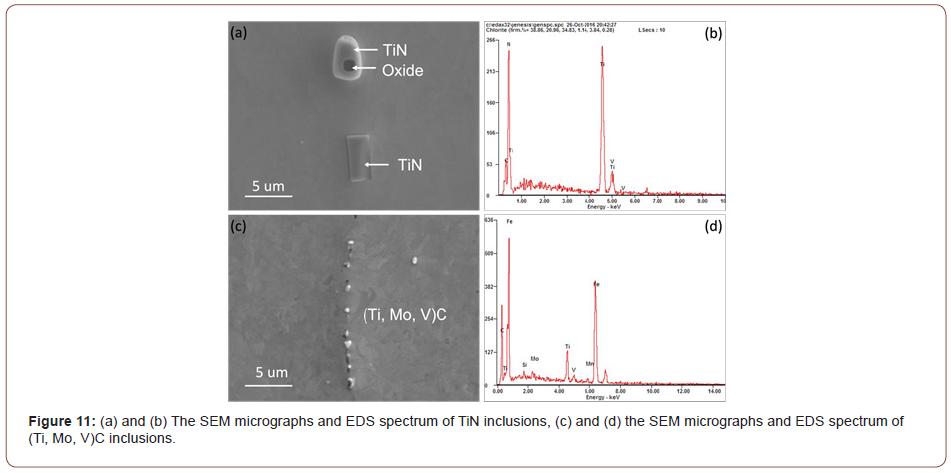

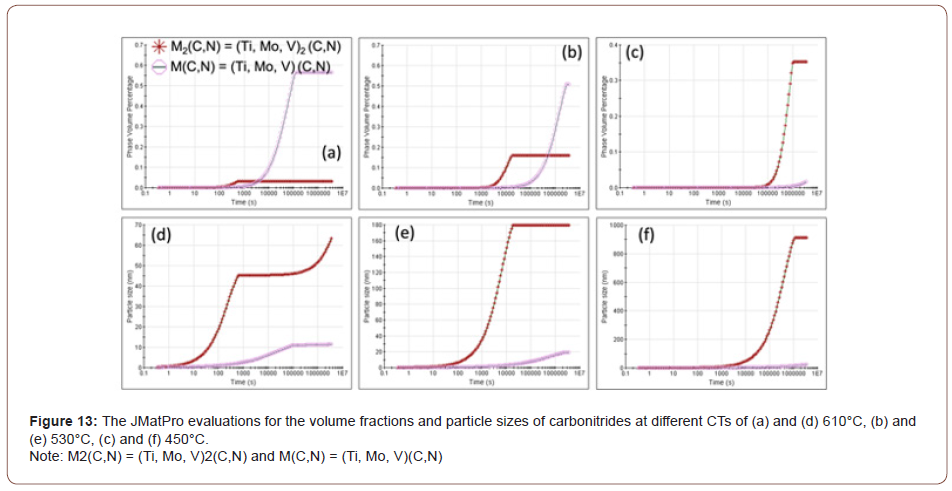
The observations shown in Figure 12 led to a further study of precipitation in these conditions using JMatPro predictions. Figure 12 and 13 revealed three kinds of precipitates TiN, M2C and MC, where M was found to be approximately M(Ti, Mo, V) using qualitative EDS. The TiN size was about 2-4 μm, the M2C was in the size range of about 200-500 nm, and the MC was about 10-20 nm. The result of the JMatPro prediction concerning the M2C and MC precipitation for the three CTs is presented in Figure 13. The sizes and approximate compositions of the very fine MC precipitation in the steel condition with the CT of 610°C, i.e., FRT 870°C and CT 610°C, in Figure 13(a), were verified by TEM and EDS of extraction replicas. These MC carbides were about 10-20 nm in size.
In this study, it was observed that at lower coiling temperatures, hard phase such as M/A constituents and low temperature transformation products like AF, GB or UB were found in the steels. And for the steels with a CT of 610°C, the microstructure was mostly a mixture of PF and QF. To verify the JMatPro predictions for MC precipitation at CT 610°C, TEM of extraction replicas was performed. These results are shown in Figure 14 which exhibits a large quantity of very small MC particles of size near 10 nm in the PF formed with the CT of 610°C. No similar small particles were found at lower CTs.
Mechanical properties
Mechanical properties of the hot band steels: After the microstructural characterization of the hot bands, multiple mechanical testing methods were applied to evaluate the mechanical properties of steels produced from different processing conditions. Typical tensile curves for the nine conditions are shown in Figure 15 and the resulting data presented in Table 3, which shows the tensile, hardness and HER properties of all the steel conditions.
From the Vickers hardness results in Table 3, the VHN of steel conditions with a CT of 610°C is the highest, with a number over 400 HV; and the steel condition with a CT of 450°C has an average VHN value about 350 HV; the steel conditions with a CT of 530°C have a VHN around 300 HV. It is obvious that the coiling temperature has an important influence on the hardness, while the finish rolling temperature was not a major factor in mechanical properties. Also, from this table, the YS of the hot band steel conditions ranged from 811 MPa to 1166 MPa, while the UTS ranged from 939 MPa to 1225 MPa. Meanwhile, the TE of the steels remained relatively constant, ranging from 17 % to 20 %. It seems that the higher strength of the steels did not sacrifice the ductility.
Table 3: Mechanical properties including Vickers hardness (VHN), yield strength (YS), ultimate tensile strength (UTS), yield to tensile strength ratio (YS/UTS), total elongation (TE) and hole expansion ratio (HER) of all steel conditions.


Sheared edge ductility/hole expansion data: From Table 3, it can be noticed that the hole expansion data show similar values for the steel conditions with the same coiling temperature. During the test, none of the steel conditions with a CT of 610°C survived the hole punching step, showing long cracks emanating from the hole edge well into the rolling plane. In this case, the pre-punched hole did not expand at all in the hole expansion test, and the entire sheet cracked during initial hole punching; the hole expansion test (HET) failed with the occurrence of a serve crack on the surface of rolling plane (RD × TD), shown in Figure 16(a). In terms of the steel conditions with a lower coiling temperature, i.e., 530°C or 450°C, the HET was not completed until the crack penetrated through the punched and expanded hole surface, as required by the test standard. From Table 3 and Figure 16(b) and (c), it can be concluded that the hole expansion performances of the steel conditions with the CT of 530°C were better than those of the hot band steels coiled at 450°C.


From Figure 17(a), it can be seen that two cracks originated from the edge of the hole suddenly during the expansion test, and in the Figure 17(b), there is a smooth region on the fracture surface located underneath the free surface and Figure 17(c) and (d) show the TiN found on the surface and fracture surface.
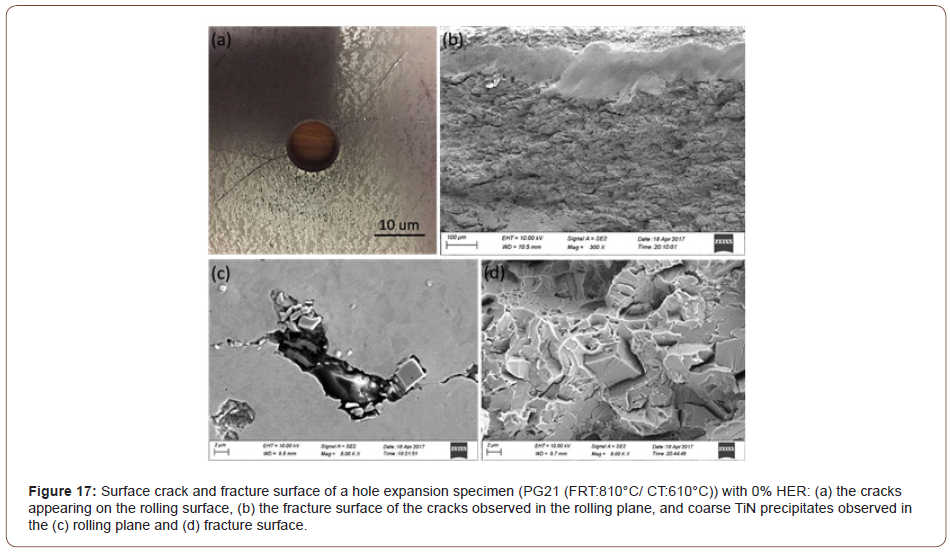
During the hole expanding test, the cone was coming from the bottom of the specimens, so this resulted in two types of deformation occurring in sequence: upward bending or bulging of the sheet and expansion of the punched hole. This caused the upper sheet surface to be in tension. During this process, the large TiN particles appeared to promote crack formation by either being cracked themselves or, more likely, by decohering from the ferrite matrix by the applied force, or by acting as a stress concentrator. These cracks would then be linked through propagation along the punched surface until it extended through the thickness resulting in the final failure. A higher strength matrix will have less accommodation ability to relieve the concentrated stress brought by the TiN particles. Furthermore, the smooth area shown in Figure 17(b) is the tear region of this sudden failure. That is one reason why the HER drops as the strength of the material increase
Discussion
Matrix transformation behavior
Although the tensile properties were only weakly affected by the FRT, they were strongly influenced by the CT, Table 3. As illustrated in Figures 2-4, with falling CT, the matrix followed a well-recognized pattern, as described by the various classification system reviewed by Krauss [23]. These included classifications proposed originally by Dube [24], then followed by Ohmori [25], Bramfitt and Spear [26], Araki, ISIJ Bainite Committee [27] and finally Wilson [28]. In these systems polygonal ferrite is the predominant phase formed at the highest transformation temperature, followed with falling temperature by quasi-polygonal or massive ferrite, then acicular ferrite, then granular bainite + particulate M/A constituents, then bainitic ferrite + lath-like M/A constituents [28]. In this study, there were mixtures of ferrite types at each coiling temperature, but the microstructural evolution trend was clear. For example, concerning the steel conditions with the FRT of 810°C, in Figures 2(d) and 3(a), PF, QF and AF with a little M/A were found after coiling at 610°C. In Figures 2(e) and 3(b), representing coiling at 530°C, QF, AF, GB and UB and M/A, were observed. After coiling at 450°C, Figures 2(f) and 3(c), GB, QF, small amounts of AF, UB and M/A were found.
The IPF presented in Figure 5 indicated that the ferrite grains formed at CT 610°C were fairly uniform in size with a random distribution of grain orientations. At 530°C, Figures 5 (e) and 5 (h), there appeared both fine PF plus large, elongated QF grains with grain direction normal at or near {101} or {222}. In Figure 5(f) coiled at 450°C, there were again large grains of ferrite with grain normal orientations at or near {101} or {222}.
The KAM technique is a good way of estimating the local dislocation density of ferrite [29,30]. The KAM results are presented in Figure 6, with Figure 6(a) showing dislocation density in specimens with a CT of 610°C. In Figure 6(a), the presence of mainly PF is represented in blue signifying a low dislocation/sub-grain boundary density; with some QF in green with higher dislocation/sub-grain boundary density; and a little AF in yellow, with even higher dislocation/ sub- grain boundary density. With falling CT, it is clear that the amount of PF, QF and AF change with PF declining and QF and AF increasing.
The literature has shown that PF, QF and AF are bounded by high angle grain boundaries [30-33], while their internal dislocation/ sub-grain boundary densities are normally taken to be given by the peak height at a few degrees on the grain boundary misorientation distribution plots such as shown in Figures 7(d) and 7(e). On the other hand, GB and UB are not bounded by HAGBs, but their internal dislocation/ sub-grain boundary density still exist. It is instructive to note how the ratio of LAGB to HAGB changes with CT, Figure 7(a) for a FRT of 870°C. This ratio can be estimated by using the peak heights at 3.6° for the LAGB, as shown by Huang and Humphreys [34] and the wellknown 44.5° degrees for HAGBs. This ratio is approximately 2.79 for a CT of 610°C, indicating a high proportion of HAGB, and about 26.2 for the CT of 450°C, indicating a low proportion of HAGB, or, alternatively, a high proportion of LAGBs. Figure 7 clearly indicates the change in defect structure with CT. The large amount of HAGB found at CT 610°C can be caused by PF, QF or AF, since all three have been found to be bounded by HAGB. However, since the amount of PF is rather high and the grain size rather small, the SV of the PF would be high and can safely be assumed to be responsible for the low peak at 3.6° and the higher peak at 44.5° in Figure 7.
Precipitation behavior
In this highly micro-alloyed steel, precipitates were found that had nucleated in both austenite during hot rolling and ferrite during cooling. As was shown in Figure 8 and Table 2, the M/A constituents, appearing white in Figure 8, was observed at all three CTs, but were most prevalent at the lower CTs. In addition, there were small islands of bainite, and individual carbides observed which appeared black with the etchant used, Figure 8. With a CT of 530°C , the carbides and M/A grains were small and randomly distributed; however, with the CT of 450°C both sets of particles became larger in size and more segregated, which could be deleterious to fracture resistance.
In addition to the M/A and bainite constituents, Figures 10-12 revealed lines of particles of TiN, MC and M2C, where M(Ti,Mo,V) and MC included TiC, VC and M(Ti, Mo, V)C. The existence of particles of MC and M2C was also predicted by JMatPro and is presented in Figure 13. JMatPro predicted a volume percent of 0.04% with size near 50 nm, Figure 13, whereas it predicted a volume percent of 0.57%, with size near 10 nm. The small size of MC predicted by JMatPro at the CT of 610°C, led to the TEM results shown in Figure 14, where the MC particles were observed to exhibit a size of 10-20 nm. These particles would certainly be capable of intense precipitation hardening in the steel with a CT of 610°C; with a precipitation increment in YS of approximately 190 MPa, according to Gladman [35].
Theoretical evaluation of TiN, TiC and VC from solubility products
1. TiN: Based on the chemical composition of the steel, the hyper-stoichiometric ratio and the high levels of Ti and N in the bulk composition, together could cause TiN to form at very high temperatures. Figure 18 shows the phase diagram of the Fe-C system calculated from JMatPro. The liquidus (TL), solidus (TS), AC3 and AC1 temperatures are listed in Table 4.
Table 4: Critical temperatures (°C) estimated by JMatPro.

The TiN can nucleate in the liquid, interdendrtic pools of enriched liquid or in the solid below the equilibrium peritectic isotherm of 1458°C. When the bulk composition is high enough for precipitation in liquid at these high temperatures, the TiN is normally very large, several microns in size, and are considered to be inclusions with little positive effect. However, when the TiN can nucleate in the solid, they are much smaller in size and can be effective as Zener pinning points for grain size control. The solubility product for TiN in the liquid can be calculated using Equation 1 [35].
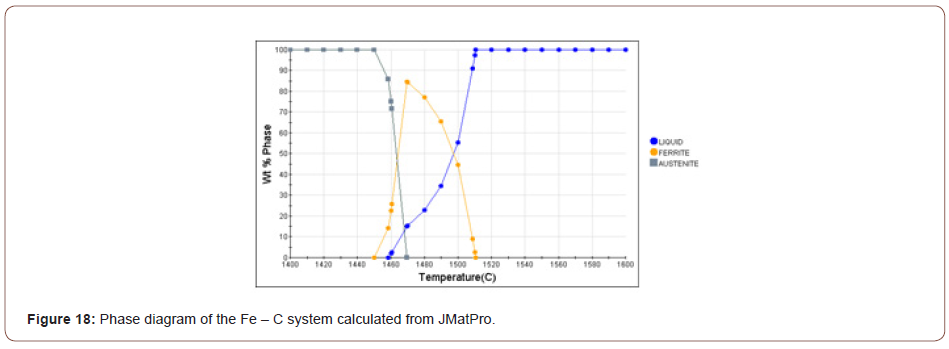

where, ks is the solubility product, [Ti] and [N] are the Ti and N contents dissolved in the liquid in wt. % and T is the absolute temperature in K. If it is assumed that all the nitrogen were dissolved in the liquid, then [N] = 0.006 wt. %. From the stoichiometric ratio of Ti/N = 3.42, the ideal titanium content needed to form TiN should be [Ti] = 0.006 × 3.42 = 0.0205 wt. %, which is less than the bulk level of 0.163 wt. %. In this case, the dissolution temperature of TiN in the liquid is 1690K (1417°C) which is lower than solidus TS (1458°C), which means that TiN cannot form in the liquid. Based on the composition, δ ferrite starts to form at 1510°C, and austenite starts to form at 1470°C and becomes fully austenitic at 1450°C. In order to calculate the solute Ti and N at the reheating temperature and to simplify the situation, δ ferrite will not be considered and 100% of liquid is assumed to transform into 100% of austenite at 1450°C. Concerning TiN in austenite, the solubility product of TiN in austenite is given by Inoue et al. shown in Equation 2 [36,37],

If we take the [Ti] as 0.0205 wt. % and [N] as 0.006 wt. %, the calculated initial TiN dissolution temperature was 1802K (1529°C). Since the formation temperature will be several degrees lower, it would still be larger than fully austenitic formation temperature at 1450°C. Therefore, the calculated volume fraction of TiN inclusions (fV) can be presented in Table 5. From Table 5, it is obvious that N would be nearly completely consumed to form the TiN precipitated in austenite and the remaining Ti which would remain in solution was 0.1425 wt.%.
2. TiC: If TiC inclusions formed in the liquid, Equation 3 [38] can be used for calculation of the solubility product of TiC in the liquid.
Table 5: Calculated the solubility product (ks), remaining Ti and N contents and volume fraction (fv) of TiN precipitates in austenite varying from temperatures.


If it is assumed that all the carbon were dissolved in the liquid, then [C] would be 0.140 wt.%. From the stoichiometric ratio of Ti/C = 1.83, the ideal titanium content should be [Ti] = 0.140 × 1.83 = 0.256 wt.%, which is larger than the bulk composition, 0.163 wt.%. If we take [Ti] as 0.1425 wt.%, the ideal carbon content in stoichiometric TiC should be [C] = 0.1425/ 1.83 = 0.078 wt.%. Under these conditions, the dissolution temperature of TiC in the liquid should be 1183K (910°C), which is much lower than TL, showing that TiC would not be expected to form in the liquid. In terms of TiC in austenite, the solubility product of TiC in austenite is expressed by Equation 4 [39],

If we take [Ti] and [C] as 0.1425 wt.% and 0.078 wt.%, respectively, the dissolution temperature of TiC in austenite will be 1488K (1215°C), lower than the fully austenitic formation temperature at 1450°C, representing that TiC precipitation in austenite occurred at or slightly below 1215°C. Therefore, the calculated volume fraction of TiC inclusions in austenite is shown in Table 6.
3. VC: If VC inclusions or particles formed in ferrite, then the solubility product of VC in ferrite can be calculated using Equation 5 [40].
Table 6: Calculated the solubility product (ks), remaining Ti and C contents and volume fraction (fv) of TiC precipitates in austenite varying from temperatures.


If it is assumed that all the vanadium were dissolved in ferrite, then [V] is 0.294 wt.%. From stoichiometric ratio of V/C = 1.92, the ideal carbon content should be [C] = 0.294/ 1.92 = 0.15 wt.%, or slightly higher than carbon level in bulk about 0.14 wt.%. After forming TiC precipitates in austenite, the remaining [C] in ferrite is 0.07735 wt.%, so the ideal vanadium content needed to form VC in ferrite can be assumed to be [V] = 0.007735 × 1.92 = 0.1485 wt.% < 0.294 wt.%. Therefore, the dissolution temperature of VC in ferrite is 1224K (951°C), which is above the AC3. The volume fraction of VC in ferrite is listed in Table 7.
Table 7: Calculated the solubility product (ks), remaining V and C contents and volume fraction (fv) of VC precipitates in ferrite varying from temperatures.

After theoretical calculation, the remaining contents of nitrogen, titanium, carbon and vanadium are 0.00003, 0.02491, 0.00092 and 0.14723 wt.%, respectively.
Electron microscopy observation: This simulated result show that there is a large amount of precipitates with a small particle size formed at the highest coiling temperature, which means the steel can still be supersaturated even after being held at the lower coiling temperatures.
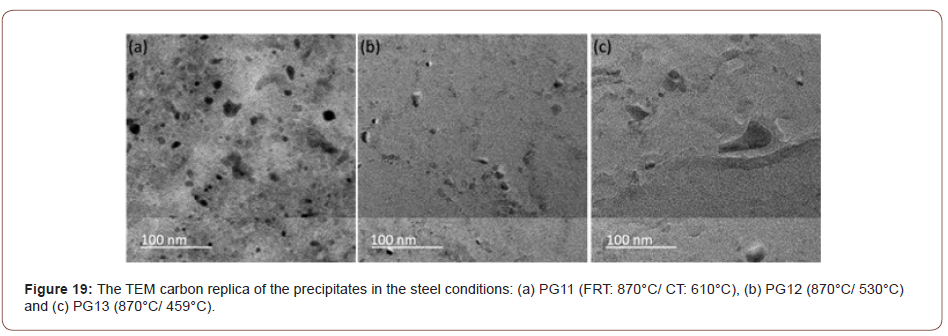
The application of the solubility product reveals that the TiN formed at high temperature had consumed most of the N, but also that a large amount of Ti remained in solution. This Ti could precipitate as fine, dispersed particles of TiC, M(Ti, V)C or M(TI, Mo, V)C during the hot rolling of the austenite or in the ferrite during coiling. Evidence of this was exhibited in Figure 14 for coiling at 610°C. For MC to form in ferrite, it must have both the thermodynamic driving force to form the particles and sufficiently high diffusivity to permit the atom movements necessary for the precipitation reaction. This latter requirement might be one reason why little or no fine precipitate was found at the lower coiling temperatures. In Figure 14 were found two size classes of particles, one with diameters in the approximate size range of 200-500 nm with a group of smaller particles of size about 10 nm. Both groups of particles appeared to be M(Ti, Mo, V)C precipitates. Similarly, sized particles were also observed in Figure 19(a), but not in Figures 19(b) and 19(c).
From the discussion before, it is known that the high strength of the steels with the high coiling temperature is due to the precipitates formed during coil cooling. And at the lower coiling temperatures, the steel could not form sufficient amount of fine precipitates to strengthen the matrix, which is shown in Figure 19, showing the TEM pictures of precipitation distribution of conditions with different coiling temperatures. It is obvious that the condition with a coiling temperature of 610°C shows a large volume fraction of fine precipitates, but conditions with lower coiling temperatures, there are not many precipitates observed on the carbon replicas.
Mechanical properties
Hot band properties: The strength changes consistently with the hardness, which is normal. What is not normal is where the strength and CT are not inversely related, where a higher strength or hardness is usually related with a lower coiling temperature due to the formation of low temperature transformation products. Normally, the steels with a polygonal ferrite microstructure at CT of 610°C should have the lowest strength, and the steels with a CT of 450°C which consist of bainite, quasi-polygonal ferrite and M/A constituents should have the highest strength. Obviously, this steel does not fit the usual pattern.
One explanation would be related to the precipitates possibly formed in the steels. Because the steels were heavily doped with unusually high percentages of microalloying elements, there is a great chance that those alloying elements will precipitate in forms of carbides or nitrides. Figure 15 shows the stress-strain curves of all the steel conditions. One interesting phenomenon is that the curve for the condition with 610C coiling temperature shows a yield point, while the conditions with lower coiling temperatures show continuous yielding behavior. Kim has proposed the effect of hard secondary phase on the yield behavior in the acicular ferrite- based structures [40]. The continuous yielding behavior and low yield ratio is associated with the secondary hard phases or low temperature transformation products, because the increased volume fraction of secondary phases can promote the movement of dislocations at the boundaries between the hard phases and nearby soft phases [41]. In this study, it is having been shown that at lower coiling temperatures, secondary hard phase such as M/A constituents and low temperature transformation products like granular bainite or upper bainite are observed. And for the condition with a coiling temperature of 610°C, the microstructure is mostly polygonal with some quasi-polygonal ferrite. In general, the appearance of a yield point is normally associated with the existence of interstitial atoms, like C or N, or fine precipitates, causing the lack of mobility of dislocations [42]. From this point of view, it can be assumed that there is a large amount of precipitates formed in the steels with a coiling temperature of 610°C, but not in the conditions with lower coiling temperatures. Therefore, because of the lack of precipitates, the dislocation brought by the microstructure will be relatively more mobile in the conditions with lower coiling temperatures, while the dislocation movement will be hindered until the accumulated dislocations break through the obstacles, i.e., fine precipitates, in the condition with a coiling temperature of 610°C. This scenario appears to be correct, as shown in this study.
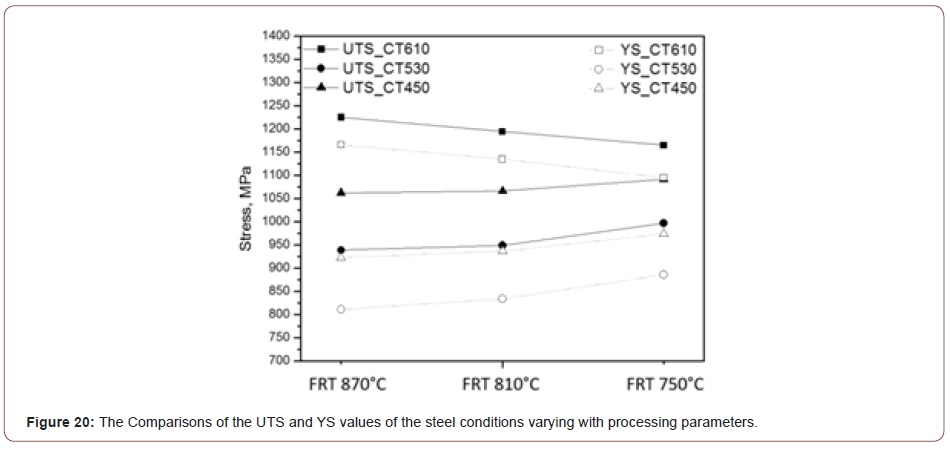
Figure 20 shows the plot of the tensile and yield strength data of all the steel conditions. It shows the effect of the finish rolling temperature on the strength. For the steels with low coiling temperatures, the strength increases with the decrease of the finish rolling temperature which can be explained by the more deformed matrix and higher dislocation density brought by the lower finish rolling temperature. However, for the steels with a coiling temperature of 610°C, the trend is in an opposite way, such that the strength decreases with the decrease of the finish rolling temperature.
Strengthening mechanism contribution: To help explain the origin of the strengths observed, we will use Expanded Hall-Petch relation expressed by Equation 7,

where, σY is the measured yield strength, σo is the lattice friction or Peierls-Nabarro stress and ΔσS, ΔσG, ΔσD and ΔσP are the contributions to the yield strength caused by solid solution, ferrite grain refinement, dislocation density and fine precipitates in ferrite matrix, respectively.
1. Lattice friction

2. Solid solution strengthening: The contribution from solid solution hardening can be illustrated by Equation 8 [43,44],

where, [C], [N], [Mn] and [Si] are the carbon, nitrogen, manganese and silicon contents in the matrix. From Table 1, [Mn] =1.370 wt. %, [Si] = 0.293 wt.%, and [P] = 0.011 wt.%. After theoretical solubility calculations of TiN, TiC and VC precipitates, the remaining contents of [N], [Ti], [C] and [V] in solution are 0.00003, 0.02491, 0.00092 and 0.14723 wt.%, respectively.
This approach results in a ΔσS~ 216 MPa.
3. Grain refinement: Since the Hall-Petch relationship describes the strengthening of ferrite by HAGBs only, the only condition that can be analyzed is that with the 610°C coiling temperature. This is because the conditions with lower CT do not have many HAGB, as noted in Figure 7, and therefore cannot be analyzed by the Hall-Petch relation, Equation 9 [45].

where, ky = 16.20 MPa∙mm-1/2 [6] and d is the average grain size of ferrite grains bounded by high angle boundaries. These ferrite grain sizes in different conditions with 610°C coiling temperature are shown in Table 8. Also, the calculated contributions to the yield strength due to grain refinement in these different conditions are listed in Table 8.
4. Precipitation hardening: From previous results, including the appearance of the yield point, the decreasing strength and the higher fraction of coarse strain-induced precipitates as the finish rolling temperature decreases in the steels with the coiling temperature of 610°C, all can be regarded as circumstantial evidences that the higher strength in the condition with the coiling temperature of 610°C is due to the formation of fine precipitates during post-rolling cooling.
Table 8: Average ferrite grain sizes (d𝘢, μm) bounded by HAGBs from EBSD and Strength contribution (ΔσG, MPa) from grain refinement.

Table 9: Strengthening contribution (ΔσP, MPa) from different types of carbides precipitates.

This theory was substantiated by the results from Figure 13, which is the simulation result of volume fraction and particle size of the precipitates predicted by JMatPro, once the specimens had been hypothetically quenched from 870°C and held at different temperatures. From Figure 13(a), (b) and (c), it can be seen that as the holding temperature drops from 610°C to 530°C and 450°C, the volume fraction of MC carbide decreases dramatically, while the volume fraction of M2C carbides increases. Figure 13(d), (e) and (f) show the size of each type of particles. It can be seen that the MC particle is always much smaller than the M2C carbide, especially at the temperature of 450°C. The M2C carbides can easily reach to hundreds of nanometers, whereas, the MC carbides always stay very small. And the course M2C particles will have less or no effect on the strengthening compared to the fine precipitates, based on the results calculated by JMatPro, and according to Equation 10 [43],

where f is the volume fraction and d is the particle size in nm. The contribution to strength from the precipitates is shown in Table 9.
From Table 9, it can be seen that at the coiling temperature of 610°C and using equation 10, the total contribution from precipitation is 220 MPa, of which 201 MPa is coming from fine MC carbides. Verifying this calculation using the Gladman approach [35] resulted in a precipitation strengthening increment of 190 MPa for the MC particles with a CT of 610°C. It is clear from Table 9 that the particle strengthening coming from the conditions of lower coiling temperature is much smaller; 76 MPa from 530°C and 8 MPa from 450°C. At each holding or coiling temperature, the MC carbides are responsible for the preponderance of the particle strengthening.
This simulated result shows that there is a large amount of precipitates with a small particle size formed at the highest coiling temperature, which means the steels can still be supersaturated after being coiled at lower coiling temperatures.
From the discussion before, it is known that the high strength of the condition with the high coiling temperature is due to the precipitates formed during coil cooling. And at the lower coiling temperatures, the steels could not form sufficient amounts of fine precipitates to strengthen the matrix which has been proved. The strengthening of the conditions of low CT is mainly caused by dislocation and solid solution hardening. Figure 19 shows the TEM pictures of precipitation distribution of conditions with different coiling temperatures. It is obvious that the steel with a coiling temperature of 610°C shows a large volume fraction of fine precipitates, and in the steel with a coiling temperature of 450°C, there are not many precipitates observed on the carbon replicas. If we take the 10 nm as the size of the precipitates in Figure 19(a), the volume fraction in Figure 13(a) and apply Equation 10, the Δ𝜎𝑃 can be calculated to be about 200 MPa.
5. Dislocation strengthening: Therefore, the steel condition with lower coiling temperatures did not exhibit much high strength from the fine precipitates, so the strength is mainly associated with other aspects of the microstructures. As discussed before, quasi-polygonal ferrite and bainite start to form in the steels with lower coiling temperatures, those phases are inherited with high dislocation densities which could improve the strength. So here KAM with maximum misorientation degree of 2° was applied to evaluate the dislocation densities in steels with different coiling temperatures. As Figure 21 shows, according to the color code, blue means low misorientation (lower dislocation density) and red means high misorientation (higher dislocation density). From Figures 21(a) to 21(c), as the coiling temperature decreases, the areas of regions with higher misorientation increases. And since the KAM within 2° is related to the dislocation densities, so the dislocation density increases with lower coiling temperatures, and the value calculated based on the KAM data is shown in Table 10. The results were obtained after high resolution conversion and applied Equation 11 [46,47],


The dislocation density can be expressed as a function of HRKAM, shown in Equation 12 [29],

where, ρ is the dislocation density, KAM is the HRKAM value in rad, b is the burgers (b= 0.248 nm) vector and μ is the step size (u = 100 nm).
It can be seen from the table, and combined with the results from SEM and EBSD, it is confirmed that the formation of quasi-polygonal ferrite, granular bainite and upper bainite resulted from low temperature transformation, causing the matrix to consist of high density of dislocations, which increases as the coiling temperature decreases. Meanwhile, the strength contribution from dislocation strengthening can be calculated by using Equation 13,

where, M is the Taylor factor (M=1.84), 𝛼 is a constant dependent on structure (𝛼=0.24), G is the shear modulus (G=83 GPa) and b is the burger’s vector (b=0.248 nm) and 𝜌 is the dislocation density (shown in Table 10), which is related to the KAM value. Therefore, the increases in yield strength, attributed to dislocation strengthening, for steels with FRT of 810°C are listed in Table 11.
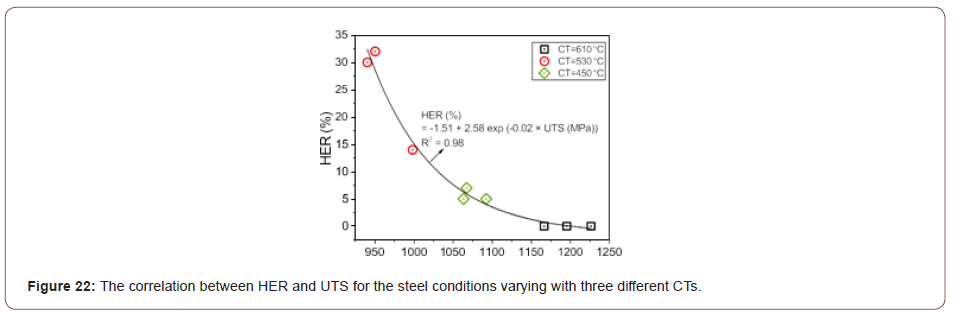
Sheared edge ductility/ hole expansion properties: As illustrated in Table 3, the steel conditions with the same CT have similar HER results. The steel conditions with the CT of 530°C had the best hole expansion performances; the CT of 450°C had limited HER data; and concerning the CT of 610°C, the cracks did not occur through the punched hole surfaces but on the rolling planes (RD × TD), Figure 17(a). The correlation between the HER and UTS for the steel conditions varying with three different CTs was plotted in Figure 22, based on the data listed in Table 3. The plot shows that HER can be described as a function of UTS with a high regression coefficient (R2 = 0.98), and that HER increases with falling UTS, which conforms to the earlier published investigations [9,49].
Table 10: Dislocation density (ρ, cm-1) from HRKAM.

Table 11: Strength contribution (ΔσD, MPa) due to dislocation strengthening from HRKAM values

The literature in HER studies shows that the through-thickness cracks were often associated with (i) the decohesion of the ferrite/ hard phase constituents interfaces, (ii) martensite cracking, (iii) ferrite/ferrite boundaries near the punched hole surfaces and (iv) MnS inclusions or other second phase precipitate particles (i.e., TiO or TiN) [50-53]. In this study, it is surprising that the steel conditions with the CT of 610°C failed in HET, Figure 1(a), even if the final microstructures of this steel condition consisted mainly of PF and QF, Figure 3(a). From the fracture mechanism, the crack initialized at the inclusions associated with coarse TiN precipitate particles after hole punching, Figure 17(c). With the further plasticity caused by sheet bending and hole expanding, the crack propagated immediately through the rolling plane resulting in the brittle fracture, Figure 17(d).
In addition to coarse TiN precipitates, the high dislocation densities or volume percentages of sub-grain structures also have negative influences on hole expansion behaviors. In terms of the sheared-edge ductility of the low-temperature coiled hot bands, it is obvious that the CT of 530°C had a better hole expansion behavior than that of 450°C, since the steels conditions with the CT of 450°C had higher dislocation densities, estimated by EBSD-KAM technology, Table 10. High dislocation density or high internal strain apparently can cause damage for hole expansion and limit HER.
Conclusion
Ultra-high strength hot band steels were produced and investigated in this study. The analysis was based on the microstructure characterization and mechanical tests. Several conclusions have been drawn as follows:
1. The finish rolling temperature does not have obvious effects on the microstructure. However, the microstructure in the matrix was observed to change from mainly polygonal ferrite to quasi-polygonal ferrite to granular bainite and upper bainite, accompanied by the formation of martensite/austenite constituents as coiling temperature falls.
2. The volume fraction and average grain size of M/A constituents increase as the coiling temperature decreases. Also, due to the hyper-stoichiometric ratio of Ti and N, and the alloying levels of Ti and N, TiN precipitates nucleate at very high temperature, followed by growing and coarsening to a very large size. These large particles are very detrimental to fracture-related phenomena.
3. The high strength in the steels with the highest coiling temperature of 610°C is attributed to the 10 nm precipitates including TiC, VC and M(Ti, Mo, V)C precipitates formed during coiling process. The higher strength of the steels with the lowest coiling temperature of 450°C is due to the higher dislocation density coming from acicular ferrite, quasi-polygonal ferrite, and bainitic ferrite grains.
4. The strain-induced precipitates cannot increase the strength of the steel because of the large particle size. Also, the higher finish rolling temperature, the higher volume fraction of those precipitates.
5. The precipitates formed in steel are always controlled by the appropriate solubility product. Excessively large amounts of precipitates, inclusions, and M/A constituents can be harmful to ductility and formability.
To read more about this article...Open access Journal of Modern Concepts in Material Science
Please follow the URL to access more information about this article
To know more about our Journals...Iris Publishers
To know about Open Access Publishers


No comments:
Post a Comment