Authored by Rama Shanker
In this article we propose a two-parameter power Garima distribution which includes Garima distribution as particular case. Its statistical properties including behavior of its probability density function for varying values of parameters, moments, hazard rate function and mean residual life function has been discussed. The estimation of the parameters of the distribution has been discussed using maximum likelihood estimation. Applications of the distribution have been investigated using real lifetime datasets from engineering and medical science.
Keywords:Garima distribution; Moments; Hazard rate function; Mean residual life function; Maximum likelihood estimation; Applications
Introduction
Shanker [1] introduced one parameter lifetime distribution having probability density function (pdf) and cumulative distribution function (cdf) as
 . We have

The pdf and the cdf of Power Lindley distribution (PLD) obtained by Ghitany et al [5] are given by


Power Garima Distribution
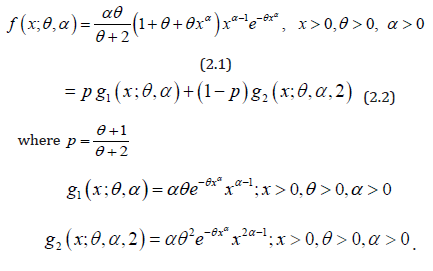
Assuming the power transformation X = Y1/α in (1.1), the pdf of the random variable X can be obtained as
The corresponding cdf of PGD can be obtained as

The nature of the pdf of PGD has been studied with the help of the graphs for varying values of parameters and presented in Figure 1.
Further, the nature of the cdf of PGD has also been studied with the help of the graphs for varying values of parameters and presented in Figure 2.
Moments of Power Garima Distribution
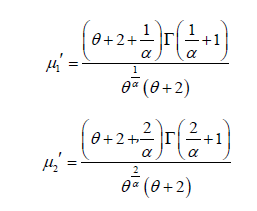
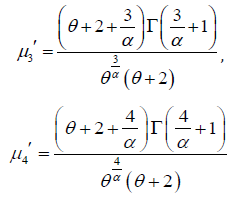
Using the mixture representation in (2.2), the rth moment about the origin,
 of PGD can be obtained as


Reliability Properties of Power Garima Distribution
The survival function of PGD can be obtained as
m(x;θ ,α ) of PGD are given respectively as:


Maximum Likelihood Estimation of Parameters of Power Garima Distribution
Suppose ( x1, x2,.....xn> ) be a random sample of size n From PGD (θ ,α ) The log-likelihood function of PGD can be expressed as

 of parameters (α ,θ )
of PGD are the solution of the following log-likelihood equations
 of (θ ,α ) can be computed directly by
solving the natural log likelihood equation using Newton-Raphson
iteration using R-software till sufficiently close values of θˆ andαˆ
are obtained.
of (θ ,α ) can be computed directly by
solving the natural log likelihood equation using Newton-Raphson
iteration using R-software till sufficiently close values of θˆ andαˆ
are obtained.Goodness of Fit of Power Garima Distribution
In this section, the goodness of fit of PGD using maximum likelihood estimates of parameters has been discussed with two real datasets. The goodness of fit has been compared with other one parameter and two-parameter lifetime distributions.Data Set 1
The data set represents the strength of 1.5cm glass fibers measured at the National Physical Laboratory, England. Unfortunately, the units of measurements are not given in the paper, and they are taken from Smith & Naylor [9]In order to compare the considered distributions, values of MLE
 along with their standard errors, -2ln L, AIC (Akaike
Information Criterion), K-S (Kolmogorov-Smirnov Statistics)
and p-values for the real lifetime dataset 1 have been computed
and presented in Table1. The best distribution is the distribution
corresponding to lower values of -2ln L, AIC, K-S statistic (Table 1).
along with their standard errors, -2ln L, AIC (Akaike
Information Criterion), K-S (Kolmogorov-Smirnov Statistics)
and p-values for the real lifetime dataset 1 have been computed
and presented in Table1. The best distribution is the distribution
corresponding to lower values of -2ln L, AIC, K-S statistic (Table 1).The Variance-Covariance matrix and 95% confidence interval (CI’s) for the parameters
 and
and  of PGD for the given dataset 1 has been presented in
Table 2.
of PGD for the given dataset 1 has been presented in
Table 2.Table 2: Variance-Covariance matrix and 95% confidence interval (CI’s) for the parameters
 and
and of PGD.
In order to see the closeness of the fit given by one parameter exponential, Lindley and Rama distributions and two-parameter Weibull distribution, PLD and PGD, the fitted plot of pdfs of these distributions for the given dataset have been shown in Figure 5. It is also obvious from the fitted plots of the distributions along with the histogram of the original dataset that PGD gives much closer fit as compared to other considered distributions (Figure 5).
Data Set 2
The following dataset represents waiting time (in minutes) of 65 dental patients, waiting before OPD (Out Patient Diagnosis) from the 25th to 29th December, 2017 at Halibet Hospital, Asmara, available in the master thesis of Berhane Abebe [10], Department of Statistics, College of Science, Eritrea Institute of Technology, Eritrea [11].The maximum likelihood estimates of parameters, standard error of estimates of parameters, AIC, K-S and p-values of the fitted distributions for dataset 2 are shown in Table 3.The Variance-Covariance matrix and 95% confidence interval (CI’s) for the parameters
 and
and of PGD for the given dataset 2
has been presented in Table 4.
of PGD for the given dataset 2
has been presented in Table 4.Table 4:Variance-Covariance matrix and 95% confidence interval (CI’s) for the parameters
 and
and  of PGD.
In order to see the closeness of the fit given by one parameter exponential, Lindley and Garima distributions and two-parameter Weibull distribution, introduced by Weibull (1951), PLD and PGD, the fitted plot of pdfs of these distributions for the given dataset have been shown in Figure 6. It is also obvious from the fitted plots of the distributions along with the histogram of the original dataset that PGD gives much closer fit as compared to other considered distributions (Figure 6).
Conclusion
A two-parameter continuous Power Garima distribution (PGD) has been introduced which includes Garima distribution, introduced by Shanker [1], as a particular case. The statistical and reliability properties including shapes of density for varying values of parameters, the moments about the origin, the variance, survival function, hazard rate function, mean residual function of PGD have been discussed. The method of maximum likelihood for estimating the parameters has been discussed. Finally, the goodness of fit of PGD has been discussed with two real lifetime datasets and the fit has been found quite satisfactory as compared to one parameter Garima, Lindley and Exponential distributions and two-parameter Power Lindley distribution (PLD) and Weibull distribution. Therefore, PGD can be considered as an important lifetime distribution for modeling lifetime data from engineering and biomedical sciences.
To read more about this article...Open access Journal of Biostatistics & Biometric Applications
Please follow the URL to access more information about this article
https://irispublishers.com/abba/fulltext/a-two-parameter-power-garima-distribution-with-properties-and-applications.ID.000515.php
To know more about our Journals... Iris Publishers
To know about Open Access publisher


No comments:
Post a Comment