Authored by Trevor J Little*,
Abstract
Running is one of the most popular sports worldwide. While considerable research has been conducted on how various aspects of running shoes may affect a runner, research on why runners wear the shoes they choose is limited. Running shoe manufacturers do not possess a reliable method with which to purposely customize and prescribe functional shoe characteristics to meet the requirements of a specific user group. This research aimed to determine if more detailed shoe market segmentation is possible for runners. The survey of 1,472 runners determined that runners are primarily concerned with their perceived comfort in a shoe. More research would be recommended on the topic; and it is possible to define comprehensive shoe market segmentation for runners. Customization of running shoes to correctly fit runners faithfully has the prospect of being the next big running shoes innovation.
Keywords: Athletic footwear; Running shoes; Running; Pronation
Introduction
Running is one of the most popular and practiced sports worldwide. While considerable research has been conducted on how various aspects of running shoes may affect a runner, research on why runners wear the shoes they select is limited. Every shoe design has different functional characteristics that influence the user feel and performance during running. Serious runners have a commitment that goes beyond just exercising for good health [1]. Currently, facets that influence runners, at different levels of involvement, to purchase shoes for running have not been wholly explored or understood in academia. In response, a main goal of this research study is to investigate the factors that could influence the runner’s purchase intentions of running shoes.
Literature Review
A study conducted in the United States from 2009 to 2017 found running to be the most popular outdoor activity with 55.9 million participants in 2017 [2]. In 2017, about 24% of Americans stated that exercise was the primary reason for them to start running [3]. Nearly 80% of American runners continue to run to stay healthy or to stay in shape [4]. Relieving stress and having fun were claimed to be the top reasons as to why people continue to run in the United States [5].
Running approach
In a survey conducted by Running Shoes Guru, they asked how long ago their respondents started running. In order to avoid confusion, they asked if a participant took a break from running and started up again, how long it had been since they got back into a regular routine. While most runners responded “3-4 years”, the second and third most popular answers (as they were tied at 14%) were “26+ years” and “1-2 years”, respectively [6]. This suggests that there are many runners that have been able to consistently run for years, but equally as many who have not. This worldwide survey consisted of over 2,500 runners and found that 43% run an average of 11-25 miles a week [7]. Although not all runners may compete, entering a race or run in a particular event is a majormotivation to continue practicing the sport. In the survey, 36% of survey respondents said that their favorite race distance was a halfmarathon [8].
Health benefits of running: Running, even 5 to 10 minutes a day at slow speeds <6 mph, is associated with markedly reduced risks of death from all causes and cardiovascular disease [9]. Approximately 24% of adults participated in running in this population. Compared with nonrunners, runners had 30% and 45% lower adjusted risks of all-cause and cardiovascular mortality, respectively. A Harvard study also found that running can add three years to a person’s life, as will many other forms of cardiovascular exercise [10]. The authors previously published data from over 55,000 people that were followed over the span of 15 years. This benefit was seen with as little as 5 to 10 minutes a day of running, even at paces as slow as six miles per hour. These results were compiled after accounting for age, sex, weight, and other health risk variables (like high blood pressure, diabetes, smoking, and alcohol consumption) [10].
Why do people run? When asked why they run, almost 50% of respondents in a survey conducted in 2017 by Running Shoes Guru answered that they run to stay fit and healthy [6]. The second and third most popular choices were to push themselves and improve their mental well-being [6]. Running the marathon was a very positive experience for the participants, producing feelings of deep personal awareness and satisfaction [11].
Brief history of running shoes
The running shoe is a relatively new invention at just over 200 years old [12]. Adolf Dassler is credited as the father of the modern running shoe. He began making shoes in 1920 with shoe designs with spikes made specifically for certain running distances [12]. This was the first time that designs focused on whether the runner was sprinting or running distance. By 1936, his designs were internationally acknowledged and worn by athletes such as Jesse Owens. In 1948, Dassler founded a company that would soon split off and become what is known today as Adidas [12]. A year later in Japan, Kihachiro Onitsuka created what would become ASICS [12]. Throughout this post war period the demand for leisure footwear grew. The fitness craze of the 1930s meant sneakers became associated with sports and leisure activities. In 1936 the U.S. basketball team adopted the Converse Chucks as the official shoe. In the same year, Dassler’s running shoes were worn at the Berlin Olympics. Demand for specialized shoes helped Nike get their start in the running shoe industry. Their first big innovation came in 1972 when rubber was poured into a kitchen waffle iron by one of the founding employees, Bill Bowerman. This was the birth of the waffle sole, as well as the best-selling running shoe in the country [12]. During the late 20th century, NASA was not only making strides for the space program but was also working with Nike to develop the first air cushioned athletic shoe. Frank Rudy from NASA brought the idea of bags filled with pressurized gas that compress under impact to Nike [12]. The bags absorb shock and cushion the foot. The cushion was placed in the soles of Nike shoes and is still used today [12]. In 1973 track athlete Steve Profontane became the first major track person to wear Nike running shoes. When the aerobics explosion took place, Reebok saw the market potential and began to make trainers in softer materials and in colors appropriate for a variety of tastes [12]. The shoes were also less rigid in construction. The 1976 Montreal Olympics was the first time an athlete was photographed endorsing his running shoes after winning the 10,000-meter race (6.2 miles) [12]. Pronation is a natural motion of the feet during walking and running [13]. A person’s gait can show a pattern of neutral pronation, overpronation, or supination (under pronation). These were the three running styles for which shoes were designed. Another advancement that running shoes received during the 1970s was the use of ethylene vinyl acetate, also referred to as EVA. This material added an air cushion to the design of a running shoe, providing runners with extra cushion and shock absorption when they ran [12]. In 1977, Brooks Vantage became the first mass-market running shoe with an EVA midsole and “varus wedge” said to control pronation [14]. New Balance 990 became the first $100 running shoe in 1982, while 1986 saw Adidas stitching in an electronic pedometer [14]. This was the first attempt to meld electronics with running shoes. Reebok released a running shoe in 1991 that had air chambers in the upper that were said to allow for a customized fit [14]. The first version of the Nike free was released in 2004 and is now seen as an early minimalist model, with the bulk of sales being attributed to non-runners [14]. The next year saw the release of the Vibram Five-fingers, a shoe originally made for outdoor activities. In 2009, Hoka One One released their first maximally cushioned shoe [14]. Not long after, in 2014, companies began competing to introduce the lightest road racing flat in the market. Today there are many running shoe companies marketing shoes to suit all styles, surfaces, distances, and speed.
Running injuries
Running injuries usually occur when a runner pushes their body too hard. WebMD was utilized as a resource to compile the top running-related injuries [15,16] runner’s knee, stress fractures, shin splints, Achilles tendinopathy (tendinitis), muscle pull and/or strain, ankle sprain, plantar fasciitis, IT (iliotibial) band syndrome, blisters, temperature-related injuries, and hip flexor strain and/or tendinitis.
Pronation: Pronation is a natural motion of the feet during walking and running. A person’s gait can show a pattern of neutral pronation, overpronation, or supination (under pronation). The stresses of overpronating or supinating have been linked to a greater risk of injuries. Motion control shoes and orthotics may be recommended if someone is an overpronator, while flexible and cushioned shoes are better for people who supinate [13].
Buying habits
In 2017, the athletic footwear industry in the United States generated 19.6 billion U.S. dollars in revenue [17]. The top 5 running shoes brands found in a survey obtained by Statista in late 2017 were Asics, Brooks, Nike, Saucony, and Hoka One [8]. This is the same survey that is referenced earlier from Running Shoes Guru. Comparing favorite brand of running shoes by average weekly mileage in the survey can be seen in Luda, 2018.
In the questionnaire, a quarter of the survey respondents said that they spent between $101 and $120 U.S. dollars on their last pair of running shoes [4]. Almost half (47%) answered between $80 and $120 [18]. When purchasing a new pair of running shoes, runners do not only look at price. They seek out comfort. The survey indicated this and found that 38% sought out comfort, 26% based their purchase on personal experience with that brand, 17% were guided by reviews, 7% chose a pair based on the brand alone, and 5% focused on recommendations [18].
Running shoe design
Various features of the design of running shoes have been known to affect the performance and safety of athletes [19] [6] (Frederick, 1984). The performance-related effects of shoe design on traction and on the economy of locomotion were reviewed in a paper by E.C. Frederick. Traction measurements in various types of running shoes and on various surfaces appeared to be adequate for all but running on wet asphalt roads. Future designs were recommended to improve traction for those conditions [19]. Top designs for maximizing running performance were recommended to provide sufficient traction, minimal weight, and maximum cushioning [19].
The optimum balance still remains to be found for the design of shoes regarding cushioning, durability, and injury prevention [20]. For the past 40 years, running shoes have been prescribed on the basis of matching shoe features to foot morphology in order to prevent running-related injuries (RRI) [21]. A recent investigation found that motion control shoes protected against injury in experienced runners who had pronated feet [21].
While minimalist shoes have historically received the most attention from researchers, clinicians, and runners, the more recent paradigms of maximalism, zero-drop shoes, and choosing a shoe based on comfort appear to be gaining in popularity. Runners, like the rest of the population, have anatomical, physiological, and kinematic differences [22]. Despite the lack of proof from the research, the market is inundated by claims from global footwear companies about the advantages of their products. Words such as “zoom”, “fast”, “elite”, and “launch pad” are used among others suggesting direct benefits from shoes, such as “better” and “safer” [23]. If running shoe manufacturers had a reliable method with which to purposely customize and prescribe characteristics to meet the requirements of a specific user group, they could add significant value to the industry, potentially minimize the prevalence of injuries that are suffered by modern runners, and limit and/or avoid more preventable lawsuits [22].
Research Method
The purpose of this study was to investigate factors in running shoes that are important to runners as well as the brand of shoe. This study investigated runners’ buying habits along with motivations and other factors that are potentially influential in their level of commitment with different types of running shoes. Elements of running and various running shoes that were explored included: running approach, buying habits, expectations, shoe uses, injuries, and content and recommendations for running shoes.
Subjects
The target population of this study consisted of runners from age 15 and older. Running often begins at an age younger than 18. The purpose of surveying 15-17-year old was to capture the experiences of high school age runners.
Survey instrument
A snowball method was used to recruit a convenience sample to participate in the survey. A survey link was posted to social media, as well as sent to several running mailing lists in North Carolina. Respondents were provided with the web-link directing them to the anonymous questionnaire. The survey took approximately 5-10 minutes for participants to complete. During the data collection process, ongoing monitoring was implemented to delete incomplete surveys and respondents that selected that they would not like to participate in the study. The data collection took place over a sevenweek duration from the end of November 2018 to the middle of January 2019.
Data analysis
When the survey link was deactivated, 1,478 responses were recorded. Of these, 1,472 chose to participate in the survey. A Python script was utilized to clean and reformat the data collected from the survey. Once processing was complete, the data was written out to a CSV file. After the file was opened in Excel, the data was compiled and analyzed using its built-in capabilities. All free response information was gathered and grouped based on relevant categories to visualize the responses cohesively.
Results
Sample characteristics
Frequency analyses were conducted to compile the sample profile. The demographic characteristics of the sample are summarized in Table 1. Among the final sample, over half of the respondents wore female running shoes (57.1%). Participants were asked at what age they started running and how many years they have been running since. Respondents averaged just over 11 years of running consistently. The age range distribution of the participants (based on the calculation of their responses to the age they started running and how many years it has been since that point) varied with over one-fourth (29.7%) being in the estimated age range of 35-44, another 23% being in the range of 45-54, 20.4% in the range of 25-34, 12.9% in the range of 15-24, and the remaining 14.1% were aged about 55 and older. Therefore, the sample profile provided enough data to be applicable for a variety of ages and gender of running shoes.
Table 1:Sample characteristics.

Research Question 1(RQ1): Running approach
In addition to demographic characteristics, respondents were asked for details about their running routine. These can be seen in Table 2 and address RQ1. “Road and/or paved surface” (80.2%) was the surface run on the most with “sidewalk” at 38.3% and “woodland trail, grass, and/or dirt” at 32.5%. Responses involving running on treadmills, track, rocky trail/gravel, sand, and other were compiled and comprised the last 24.3% of the responses. In terms of average weekly running mileage, half of the respondents (50.7%) answered “11 to 25 miles”, 21% answered “less than 11 miles”, 19.8% answered “26-40 miles”, and 8.4% answered with “40+ miles” weekly. To assess the competitive nature/habits of the respondents, they were asked their usual race distance and how many organized races they run each year on average. The usual race distance chosen by respondents (32.3%) was “5K (3.1 mi)”. “Half-marathon (13.1 mi)” was the second-highest choice at 29.9%. Most respondents (26%) answered that they run in “3-4” organized races each year, 20.1% answered “5-6” organized races per year, 17.1% answered “1-2”, and the last compiled 38.6% of respondents answered that they run in at least 7 races a year.
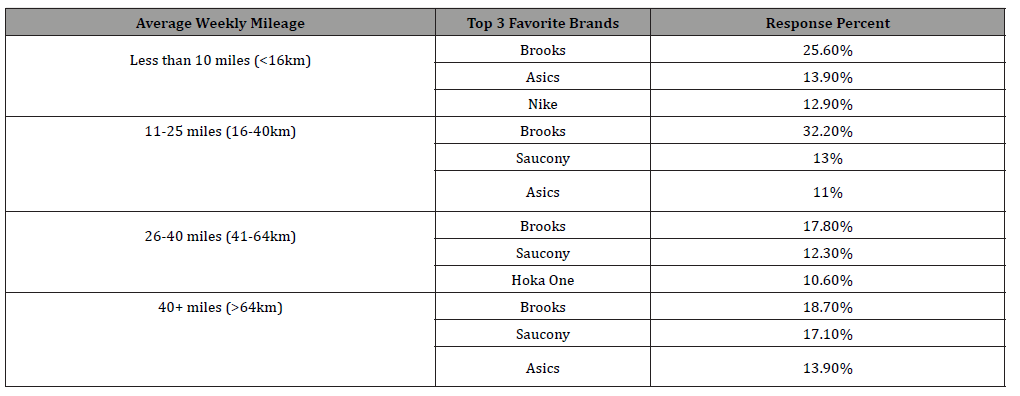
Table 3 demonstrates more survey results related to RQ1. It shows that regardless of average weekly distance, the shoe brand choice among participants.
Table 2:Running approach.
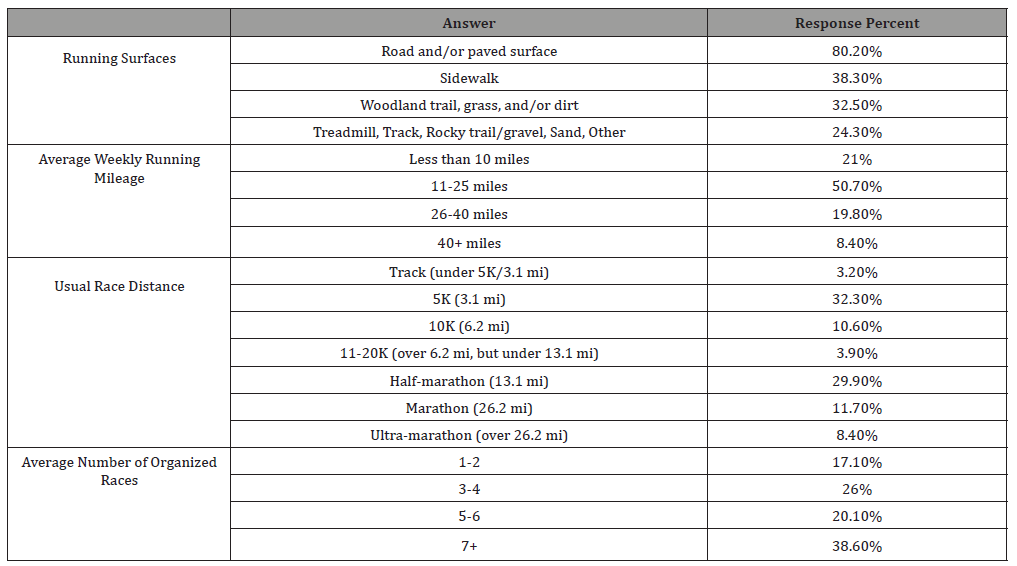
Table 3:Weekly mileage vs. Favorite brand
Research Question 2 (RQ2): Buying Habits
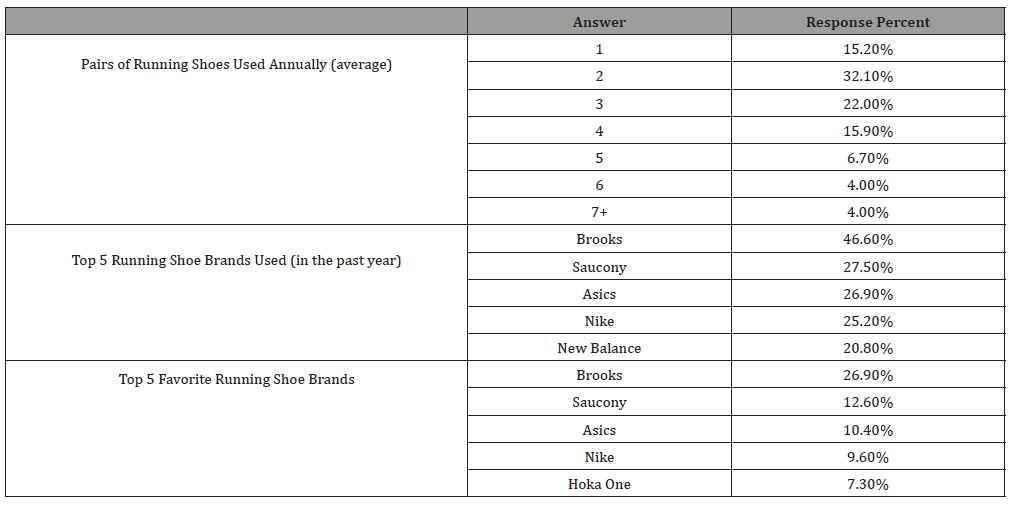
Buying habits were measured by a number of items within the questionnaire. Respondents answered that they use an average of 2 pairs (32.1%) of running shoes each year. 22% of respondents use 3 pairs, 15.9% use 4 pairs, and 15.2% only use 1 pair a year on average. To determine the most used brands of running shoes, respondents were asked which brands they used in the past year. The compiled responses can be seen in Table 4.
Table 4:Shoes used each year and brands.
Before making a running shoe purchase, people often refer to a resource. Respondents were asked what resources they have consulted before deciding on a pair of running shoes. Most (61.5%) were repeat purchases, but 56.2% of respondents consult a salesperson of some degree before making a purchasing decision. Online guides and/or online recommendations made up 42.9% and online reviews consisted of 41.9%. Comfort was chosen as the top factor (87.1%), with support (52%) and cushion (51.2%) chosen by over half of the respondents as well. Price came in fourth with 49.7% and brand (36.8%) was chosen as the fifth most popular factor. The following Table 5 shows the top responses collected.
Running shoes can be purchased in-store and online. In order to determine how runners are purchasing their shoes, respondents were asked where they purchase their running shoes. Almost half of the questionnaires indicated that respondents only purchase their shoes in-store (47.3%). Those that purchase their shoes both online and in-store came in at 26.8% and online only was 25.9%. Participants were then questioned about the average price range that they purchase shoes in. The following Table 6 shows the total responses collected for location of purchase and average price ranges.
Table 5:Resources and shoe factors.
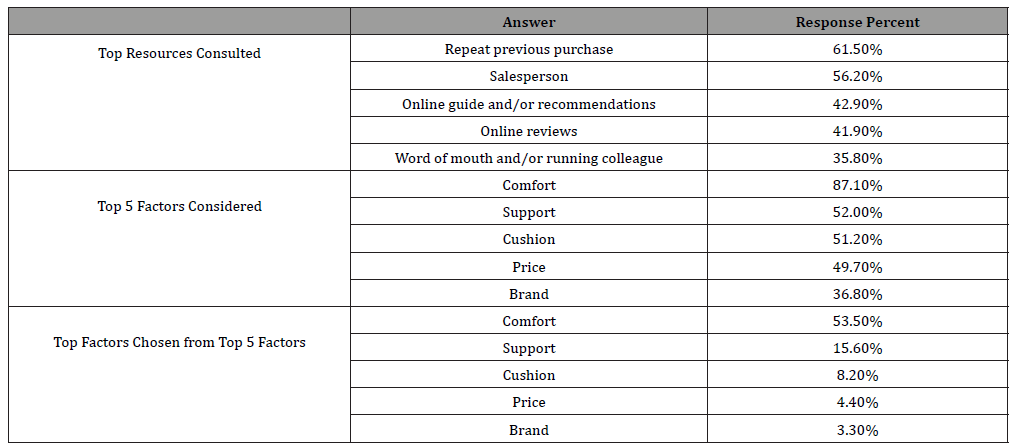
Table 6:Location of purchase and money spent.

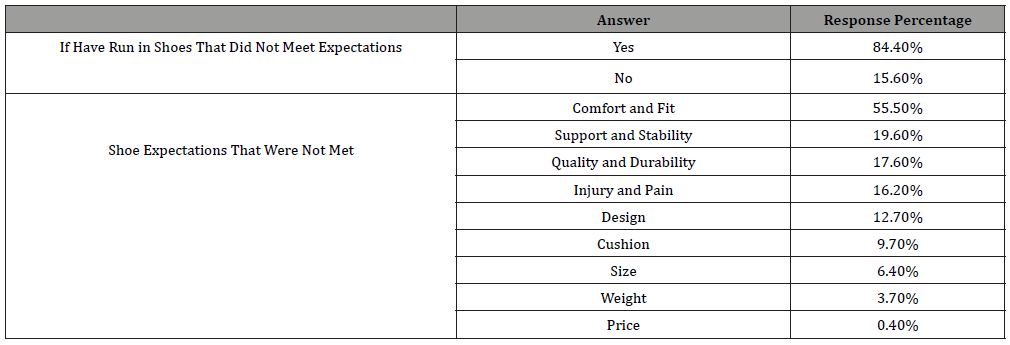
Table 7:Running shoe expectations.
Research Question 3(RQ3): Running shoe expectations
Expectations are not always met after a runner purchases a pair of running shoes. The questionnaire asked if participants have ever run in a pair of shoes that did not meet their expectations. These results investigate RQ3 and can be seen in Table 7. Out of the respondents, 84.4% answered that they have encountered shoes that did not meet their expectations. Comfort and fit are subjective and were therefore the expectations that were not met the most (55.5%). Support and stability can also be subjective and were mentioned 19.6% of the time, while quality and durability were mentioned in 17.6% of the responses.
Participants were presented with a reference picture showing examples of different gait patterns. Using this, participants were then asked what their gait pattern is when they run. Over half of respondents answered that they have a neutral gait (52.9%), while 24.6% claimed to overpronate and 14.1% claimed to supinate. These results can be seen in Table 8. When questioned if their gait pattern affects the type of running shoe they purchase, the majority of respondents answered “yes” (70.1%).
Table 8:Gait patterns.

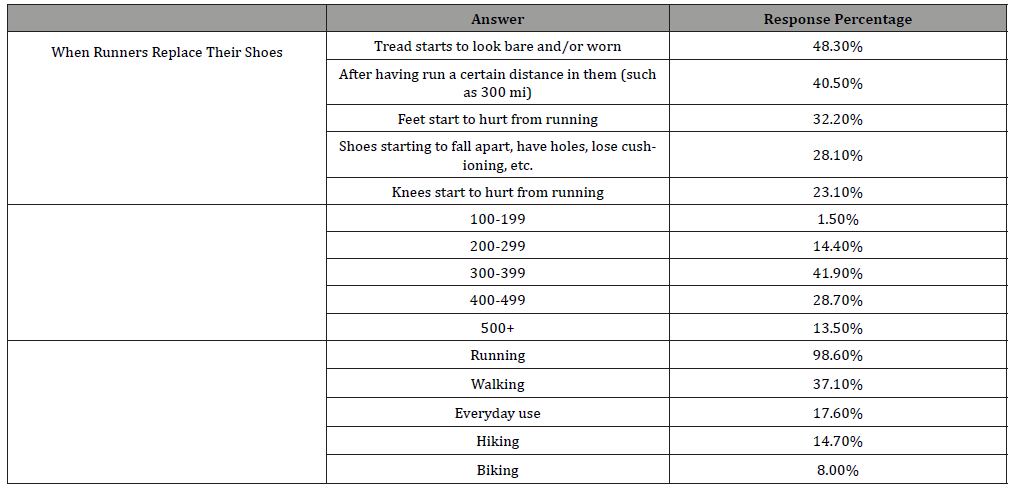
Table 9:Shoe usage.
Research Question 4(RQ4): Running shoe use
The life of a pair of running shoes may vary and many runners have different reasons for deciding to replace their shoes as shown in Table 9.
The majority of the respondents (41.9%) run 300-399 miles in their shoes, while 28.7% run 400-499 miles and 14.4% run 200- 299 miles in their shoes.
Research Question 5(RQ5): Running injuries
Injuries can be common in running-related activities. Respondents were asked if they have ever received an injury due to running and, if so, what it was related to. This section addresses RQ5 and the top results can be seen in Table 10.
Research Question 6(RQ6): Content and recommendations
Runners’ expectations of content and recommendations around running shoes can differ. To see what additional recommendations for documentation could better match the runner to the running shoe, a final question concerning this was asked on the survey. This answers RQ6 and can be seen in Table 11.
Table 10:Running injuries and causes.

Table 11:Running shoe content and recommendations.

Summary and Discussion
Running shoe comfort perception has been discussed over the past few decades, but the relationship between comfort and running shoe factors is not well established due to the subjectivity of the concept. This research aimed to determine if more detailed shoe market segmentation is possible for runners. The survey of 1,472 runners determined that runners are primarily concerned with their perceived comfort in a shoe as this factor was chosen the most frequently. Comfort was also the top issue that participants described when a shoe did not meet their expectations. Runners responded that they would primarily prefer to know what type of stability a pair of running shoes would work for best in regard to content and recommendations.
Based on the most often reported responses, the typical runner from the survey is a 40-year-old who wears women’s Brooks running shoes and has been running consistently for 11 years. This runner primarily runs on roads and/or paved surfaces for 11-25 miles every week [24]. They run at least 7 races a year, largely 5Ks. In this time frame, they use at least 2 pairs of shoes. While the runner tends to purchase their shoes in-store, they have a habit of repeating a previous purchase when they do not ask a salesperson for advice. Comfort is the biggest factor in this runner’s shoe purchase decision, and they spend between $101 and $120 on running shoes. If a pair of shoes does not meet their expectations, it was due to comfort and fit. They look for shoes aimed towards runners with a neutral gait and do not replace their shoes until the tread looks bare and/or worn, or if they have run 300 to 399 miles in them. This runner tends to injure themselves due to overuse of body and frequently deals with blisters and/or bunions. In regard to running shoe content and recommendations, this runner would prefer to know what type of stability the pair of shoes they are wanting to purchase would work for best.
In summary, more research would be recommended on the topic; and it is possible to define comprehensive shoe market segmentation for runners. Shoe manufacturers assume the left and right feet to be of equal size and this is not the case, as this is just one of the aspects that differ from runner to runner. Customization of running shoes to correctly fit runners faithfully has the prospect of being the next big running shoes innovation.
To read more about this article....Open access Journal of Textile Science & Fashion Technology
Please follow the URL to access more information about this article
To know more about our Journals...Iris Publishers


No comments:
Post a Comment