Authored by Ludmila Radkevich*,
Abstract
Aims: Investigated risk factors for cardiovascular diseases in countries with high and low Happiness Index in 158 countries in 2004.
Methods: Mann-Whitney U-test and Linear Multiple Regression Analysis (LMA); GBD 2004; FAO 1990-2005 databases.
Results: In countries with a high Happiness Index - group 1 (62 ± 8 versus 23 ± 5), income was 4 times higher, quality of life, health care was 3 times higher, and life expectancy by 23 years (p ≤ 0.001). In the countries of group 1, the overall mortality and overall morbidity were 2 times lower (p ≤ 0.001). Cardiovascular diseases were 1.5 times higher (p ≤ 0.016), cerebrovascular events were 2 times higher in group 2 countries (p ≤ 0.001). In the 1st group of countries, the share of men (%) predictors of metabolic syndrome (MS) was on average 2 times higher than in the 2nd group of countries (p ≤ 0.009). The daily food consumption in the 1st group of countries was 2 times higher than in the 2nd group (p ≤ 0.001).
Conclusion: The index of happiness can be considered a subtle and sensitive tool for assessing not only social life, but also human health.
Keywords:Happiness Index 2012; NCD; MS; Alcoholic Beverages; Hypertension; Ischemic; Cerebrovascular Heart Disease; Alcoholism; Nutrition; Risk factors
Abbreviations:AB: Alcoholic Beverage; AP: Animal Products; BMI: Body Mass Index; BP: Blood Pressure; CAB: Alcoholic Beverage Consumption; CD: Communicable Maternal Perinatal Diseases; Cho: Blood Cholesterol; CL: Consumption Level of Selected Foods; CHD: Coronary Heart Disease; CV: Cereals and Vegetables; CVD: Cardiovascular Diseases; COPD: Chronic Obstructive Pulmonary Disease; D: Disease; DALY: The Disability-Adjusted Life Year; DRD2 and DRD3: Genes Encode Type 2 and 3 Dopamine Receptors; EEI: Ecological Efficiency Index; FAO: Food and Agriculture Organization of the United Nations; FS: Fruits and Sweeteners; ICD-10: Codes - Is the 10th Revision of the International Statistical Classification of Diseases; GBD: Global Burden Diseases; GDP: Domestic Gross Product; Glu: Blood Glucose; HPI: Happiness Index; IHD: Index of Human Development; LE: Life Expectancy for Men and Women; LPA: Low Physical Activity; LMA: Linear Multiple Regression Analysis; M: Male; NS: Nutritional Structure; MSP: Metabolic Syndrome Predictors; NCD: Non-Communicable Diseases
Introduction
«Life, Liberty, and the Pursuit of Happiness» is a well-known phrase in the United States Declaration of Independence [1]. This phrase provides three examples of inalienable rights that the Declaration states were granted to all people by their creator, and governments are created to protect them. These words belong to the 3rd President of the United States (1801 - 1809). According to Aristotle, it is “the highest and most beautiful good that gives the greatest pleasure”, a perfect and self-sufficient goal of human activity, carried out “in accordance with virtue” [2]. Since the early 2000s, scientific assessment of happiness has become popular. The problem is determined by the special significance of the concept under study, as well as the interest on the part of society, due to the natural desire of every person to be happy [3]. For the first time, the so-called «Index of Happiness on the Planet» was calculated in 2006 among 178 countries of the world [4].
A person’s striving for happiness should serve as the gold standard for the development of the state [5-7]. For the first time in Bhutan, it has been proposed to give more importance to the Happiness Index rather than GDP [8]. In modern science, when assessing happiness, there is a desire to combine a quantitative analysis of the characteristics of society with a traditionally inaccurate analysis [9]. The happiness index is calculated according to several parameters (GDP, life expectancy, ecology, life satisfaction and many others [10]. Happiness indices 2006-2009, 2012-2015, and also 2016-2021 differ in the degree of inclusion in the assessment of happiness characteristics of GDP [9-11]. In medicine, there is an attempt to assess the relationship between the Happiness Index and general morbidity and mortality [11-14]. The association of the Happiness Index with the burden of cancer [15], cardiovascular diseases [16,17] and diabetes [18] is assessed.
Happiness is a concept that is gaining increasing importance in both social research and health research. Living standards and satisfaction with life achievements are more important in subjective well-being than health satisfaction [19]. Objective: To analyze risk factors for cardiovascular and comorbid diseases in countries with high and low Happiness Index.
Tasks:
1. Analysis of the quality of life in two groups of countries.
2. Analysis of predictors of metabolic syndrome in two groups of countries.
3. Analysis of the burden of cardiovascular and comorbid diseases in two groups of countries.
4. Analysis of consumption levels of food and nutrients, including alcoholic beverages in two groups of countries.
5. Assessment of the influence of risk factors, as independent variables, on the burden of cardiovascular disease, as dependent variables in a multiple linear regression model.
Material and Method
Study design: Statistical analysis of observations
For the work, a database of NCDs was formed: the burden of cardiovascular and comorbid diseases (ICD-10 codes) for 158 countries. From 158 countries of the base, 2 groups of 15 countries in a group were selected.
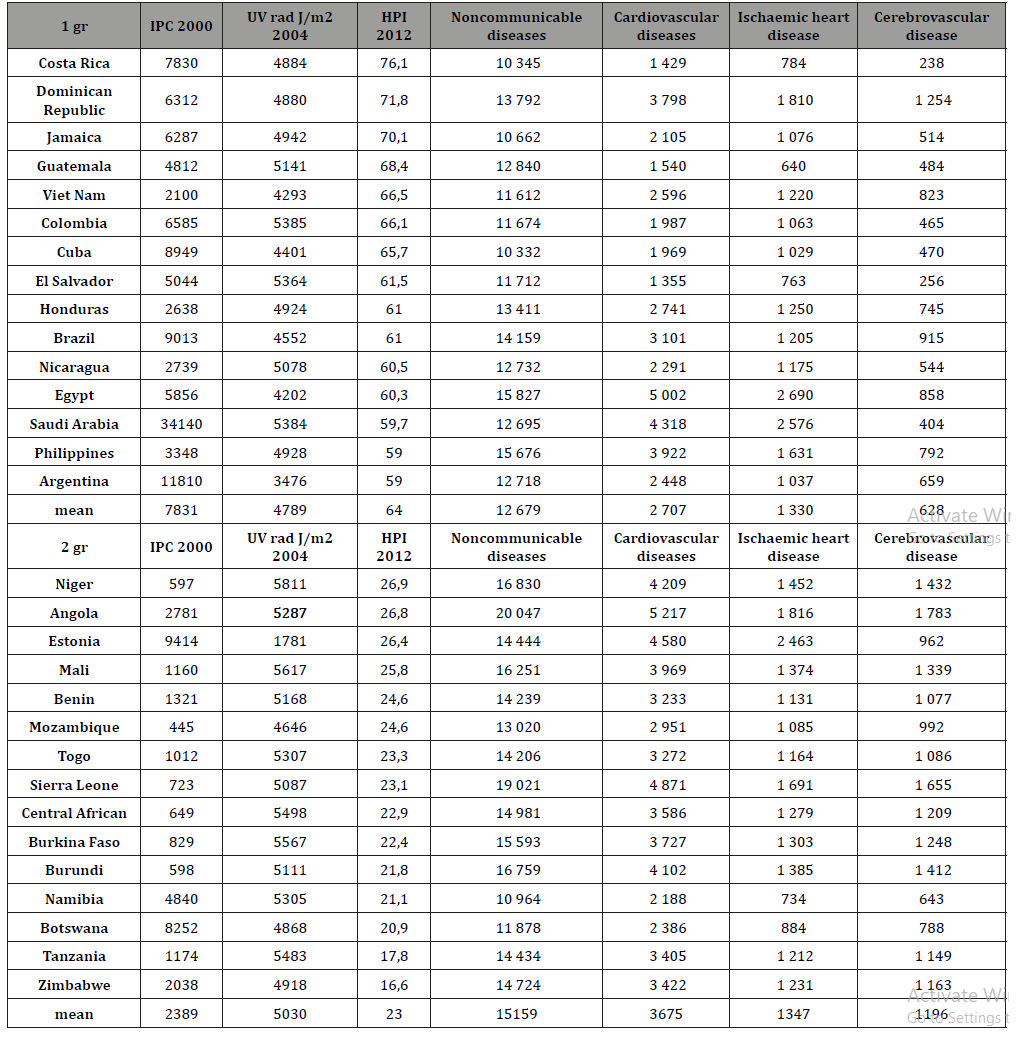
Group 1: countries with the highest Happiness Index ().
Group 2: countries with the lowest Happiness Index (Table 1 - List of countries).
Disease burden (DALY) data for men in 158 countries, standardized by sex and age per 100,000 population, were sampled from the 2004 GBD database [20]. To characterize the “quality of life” (QOL) in countries, a number of indicators were used: per capita income (GDP) in 2000–2016 (US dollars per person per year) [21]; geographical position of countries in latitude and level of ultraviolet radiation in the capital of the countries (UV) (J / m2 2004) [22]; life expectancy for men and women (2008 and 2016) [23]; access to quality medicine, clean water and clean air [24]; Index of Happiness and Prosperity (IH) 2012 [25, 26].
Predictors of metabolic syndrome (MS) - the percentage (%) of men in the country with a Body Mass Index (BMI) ≥25 kg / m2 and ≥30 kg / m2; the level of cholesterol in the blood (Chol. ≥ 5.0 mmol / l and ≥ 6.2 mmol / l); Blood glucose (Glu. ≥ 7.0 mmol / l); Blood pressure (BP ≥ 140/90 mm Hg); Low physical activity (LPA ≤ 60 min / day of walking) [27]. The daily food consumption rate (TDC) (g / person / day) (50 foods) for each country was selected from the FAO database for 1992-2005 [28]. The structure of nutrition (NS) of countries is presented in the form of 4 blocks in absolute and percentage terms of TDC: 1 - products of animal origin (AP); 2 - grains and vegetables (CV); 3 - fruit and sweeteners (FS); 4 - alcoholic beverages (strong alcohol, wine and beer) (AB) [28].
Statistical analysis of the study results was carried out using the Mann-Whitney-Wilcoxon U-test. The central trend in the distribution of data in the sample was represented by the Median with Quartile Range and the Mean and Standard Deviation. Sample variance was estimated using the Quartile Range (QR) between the first and third quartiles (25th and 75th percentiles) and the Standard Deviation of the Mean. The level of statistical significance, reflecting the degree of confidence in the conclusion about the differences between indicators of 1 and 2 groups of countries, was assessed for two levels of accuracy: p≤0.01 - probability of error 1%; p≤0.05 - error probability 5%. In multiple comparisons, the Bonferroni correction was used to assess the significance of the study results, taking into account two hypotheses (p≤0.025).
Analysis of the dependence of the burden of NCD on risk factors (quality of life, MS, food) was performed using models of Multiple Linear Regression Analysis for «independent variables» (MLRA). Standardized NCD disease burden indicators from 2004 were used as the MLRA’s “dependent variable” [20]. Indicators of risk factors were used as “independent variables”. A step-by-step procedure for including «independent variables» was applied to obtain the best regression equations containing the minimum number of predictors statistically significantly associated with the «dependent variable». The quality of the regression model was assessed using multiple correlation coefficient (R1), determination coefficient (R2), F-distribution, t-tests for regression coefficients, and residual analysis. The residuals in the models had a normal distribution. An analysis of the values and signs of the coefficients of the β * and β regression equations made it possible to estimate the contribution of “independent variables” - risk factors - to the values of the burden of NCD types. We forecast how much the “dependent variable” will change when the “independent variable” is changed by a unit of measurement. All calculations were performed using the STATISTICA program (version 13).
Result
Group 1: 15 countries with the highest Happiness Index: 62 ± 8 (Median 1 ± Quartile1) (Costa Rica, Dominican Republic, Jamaica, etc.) (Table 1).
Group 2: 15 countries with a minimum Happiness Index: 23 ± 5 (Median 2 ± Quartile2) (Botswana, Tanzania, Zimbabwe, etc.) (p ≤ 0.001) (Table 1).
Table 1: Groups of countries 1 and 2.
Quality of life analysis in groups 1 and 2 using the U-Mann-Whitney test
GDP (IPC) of group 1 in 2000 was 4 times higher than group 2 (p ≤ 0.001). The Gini Index (2021) in group 1 was 1.07 higher (p ≤ 0.002). The geographical latitude of the countries of the 1st group did not statistically differ from the 2nd group: 18 ± 8 and 12 ± 14 (p ≥ 0.09). However, the level of ultraviolet radiation (UV rad J / m2 2004) was higher in group 2: 5287 ± 580 versus 4924 ± 740 (p ≤ 0.042). Group 2 was 4 times closer to Greenwich (p ≤ 0.001) (Table 2). The ranks of well-being, education, and social capital in group 1 were 1.6 times higher than in group 2 (p ≤ 0.01). By the rank of corruption, the countries of the 1st and 2nd groups did not differ (p ≥ 0.2). Group 1 were 1.5-3 times higher than the Index of human development (IHD) and the Ecological efficiency index (EEI) (p ≤ 0.001).
0.042). Group 2 was 4 times closer to Greenwich (p ≤ 0.001) (Table 2). The ranks of well-being, education, and social capital in group 1 were 1.6 times higher than in group 2 (p ≤ 0.01). By the rank of corruption, the countries of the 1st and 2nd groups did not differ (p ≥ 0.2). Group 1 were 1.5-3 times higher than the Index of human development (IHD) and the Ecological efficiency index (EEI) (p ≤ 0.001).
Analysis of the burden of disease in groups 1 and 2 countries using the Mann-Whitney U test Analysis of the burden of cardio-morbidity in groups 1 and 2 countries
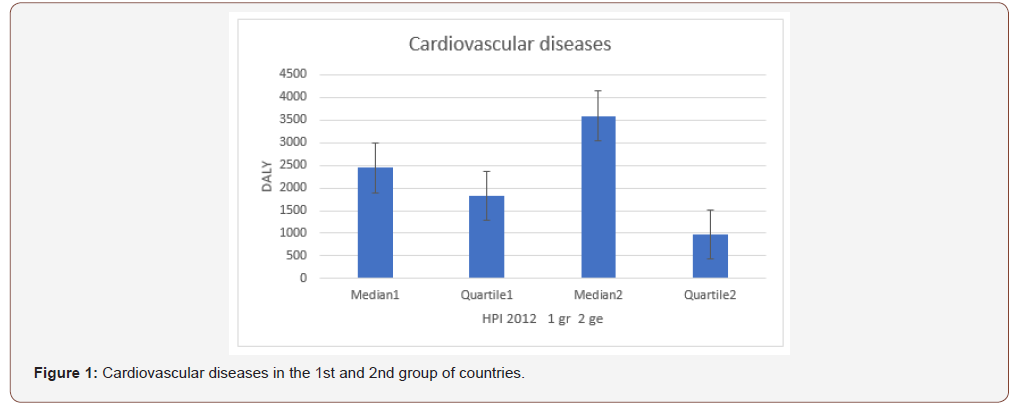
Table 2: Comparative analysis of the quality of life, the burden of NCDs and MS 1 and 2 groups of countries differing in the Happiness Index (Mann-Whitney U-test).
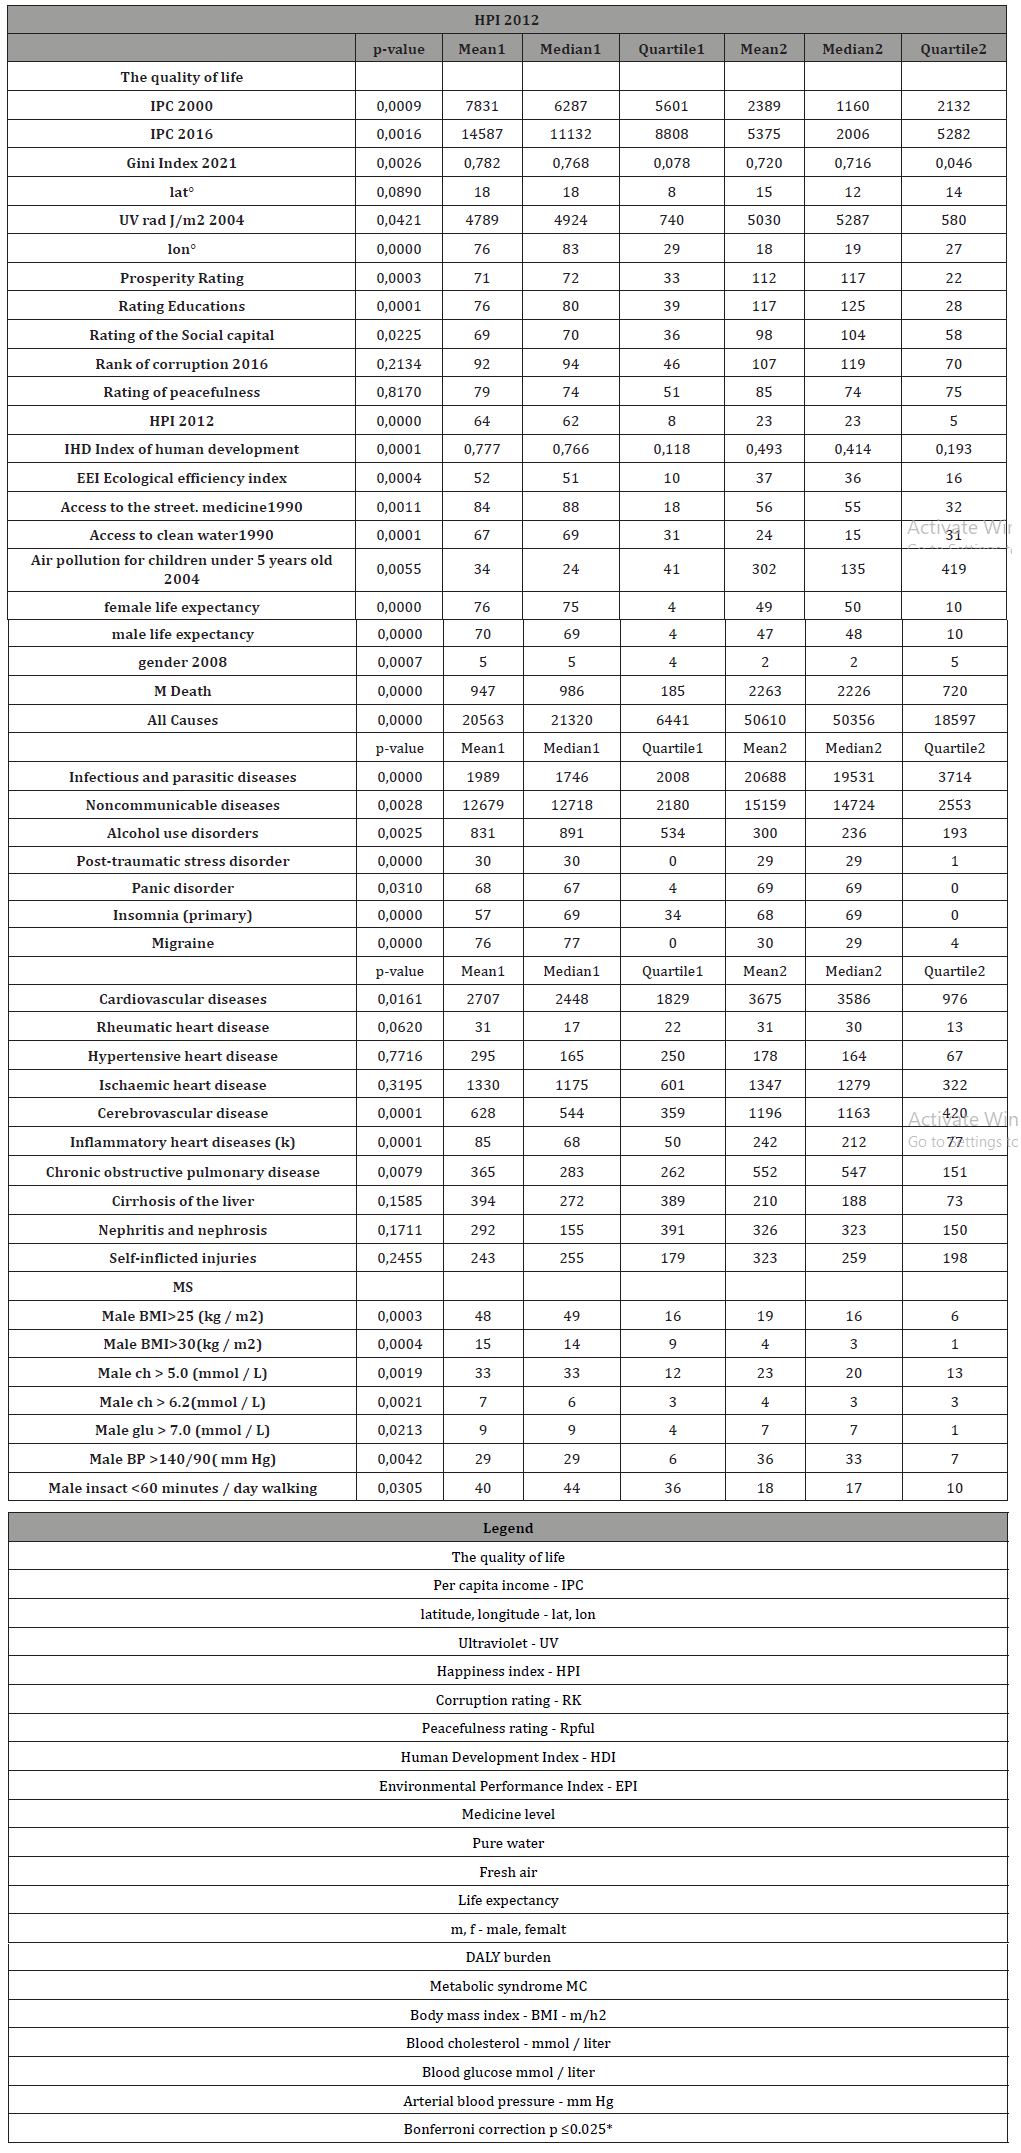
In the 1st group of countries with a high Happiness Index, the overall male mortality in 2004 was 2.3 times lower than the mortality of the 2nd group with a low Happiness Index (p ≤ 0.001) (Table 2). In the 1st group of countries with a high Happiness Index, the overall male morbidity in 2004 was 2.2 times lower than the general morbidity of the 2nd group of countries with a low Happiness Index (p ≤ 0.001). In the 1st group of countries, the total male Infectious and parasitic diseases in 2004 was 11.2 times lower than the 2nd group with a low Happiness Index (p ≤ 0.001). In group 1 of countries in 2004 it was 1.2 times lower than group 2 of countries Noncommunicable diseases (NCD) (p ≤ 0.001) (Table 2). The total burden of cardiovascular diseases in the 1st group of countries was 1.5 times lower than in the 2nd group: 2448 ± 1829 versus 3586 ± 976 (p ≤ 0.016) (Table 2) (Figure 1).
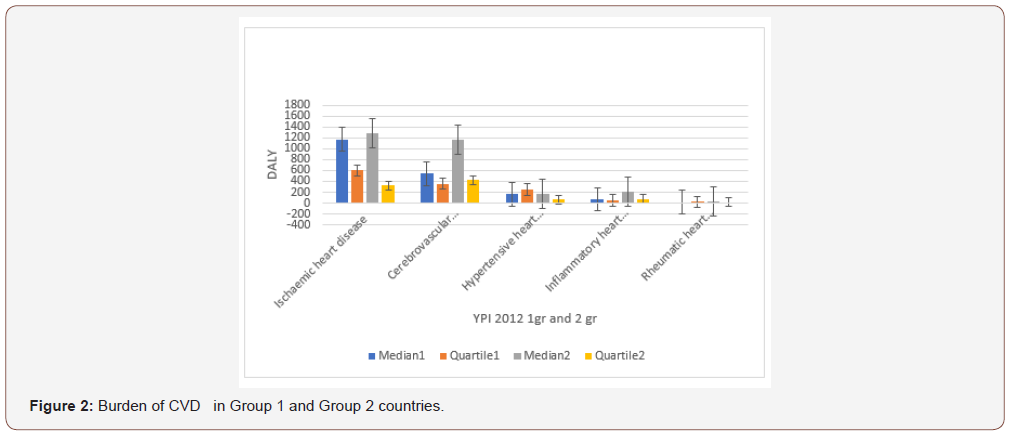
The burden of Rheumatic heart disease, Hypertensive heart disease, and Ischaemic heart disease was not statistically different between group 1 and group 2 (p ≥ 0.7). The burden of Cerebrovascular disease was 1.8 times lower in group 1 of countries than in group 2: 544 ± 359 versus 1163 ± 420 (p ≤ 0.001). The burden of Inflammatory heart diseases was also 2.8 times lower in group 1 of countries compared to group 2 of countries: 68 ± 50 versus 212 ± 77 (p ≤ 0.001) (Table 2).
Analysis of predictors of metabolic syndrome in groups 1 and 2
Body mass index, Cholesterol and Blood glucose, Blood pressure, Low physical activity were assessed by the proportion (%) of MS predictors in the populations of countries of groups 1 and 2. In group 1 of countries, the proportion of men (% in populations) of six predictors of MS was, on average, 3 times higher than in group 2 of countries (p ≤ 0.009) (Table 1). At the same time, the predictor of MS “BP> 140/90 (mm Hg)” was 1.2 times lower in group 1 of countries (p ≤ 0.004) (p ≤ 0.004) (Table 2).
Analysis of the burden of some comorbid diseases in groups 1 and 2 of countries
There were no statistical differences in the burden of Diabetes mellitus (p = 0.06) between countries 1 and 2 (Table 2). Group 1 countries had 1.3 times the burden of group 2 of Unipolar depressive disorders (p ≤ 0.001). In the 1st group of countries, the burden of Bipolar disorder was 1.2 times lower than in the 2nd group (p ≤ 0.001). Group 1 had 2.8 times the burden of Alcohol use disorders (p ≤ 0.003) in Group 2. Group 1 countries had 1.3 times lower burden of Parkinson disease (p ≤ 0.020). In group 1 countries, the burden of Alzheimer and other dementias was 1.3 times higher than group 2 (p ≤ 0.001). In group 1 countries, the burden of Posttraumatic stress disorder was 1.03 times higher than group 2 (p ≤ 0.001). In group 1 countries, the burden of Panic disorder was 1.01 times lower than group 2 (p ≤ 0.031). The burden of Migraine was 2.5 times higher in group 1 countries (p ≤ 0.001) (Figure 2).
There were no statistical differences in group 1 of countries from group 2 for the burden of Cirrhosis of the liver (p = 0.59). There were no statistical differences in group 1 of countries from group 2 for the burden of Nephritis and nephrosis (p = 0.17). There were no statistical differences in group 1 of countries from group 2 of the burden of Self-inflicted injuries (p = 0.26) (Table 2).
Analysis of the Impact of Risk Factors on the Burden of Cardiovascular Disease Using Multiple Linear Regression Analysis
The burden of cardiovascular disease was investigated as a dependent variable. A group of 12 types of comorbid diseases was used as independent variables; MS predictors; daily consumption of alcoholic beverages (AB) (strong alcohol, wine and beer, AB amount,% AB); group of Daily levels of food consumption (Red meat, Fats, Animals, Fish amount, Grains and legumes, Oil amount, FD amount, AB amount); The quality of life (Index of human development, Ecological efficiency index, Access to the street. Medicine, Access to clean water, Access to clean Aair); Energy, Proteins, Fats (kcal / person / day) 1990-92; 2003-05. The research results are presented in (Table 3).
Effect of independent variables on the dependent variable for the burden of cardiovascular disease
Panic disorder, Self-inflicted injuries, and Cirrhosis of the liver (R1 0.760; R2 0.578) had a statistically significant effect on CVD DALYs from 12 comorbid diseases. A unit increase in the independent variable Panic disorders (by 1 DALY) was accompanied by an increase of 422 DALYs in CVD (p ≤ 0.001). The effect of Self-inflicted injuries was 2 DALYs (p ≤ 0.001). Influence of Cirrhosis of the liver -1 DALYs (p ≤ 0.001). Thus, comorbid diseases caused an increase in CVD DALYs. R2 = 0, 578 shows that more than 50% of the variability in DALY CVD can be caused by some comorbid disorders (Table 3). The statistically significant effect of the remaining independent variables was more modest. They provided about 20% of the DALY CVD variability (Table 3) (Figure 3).
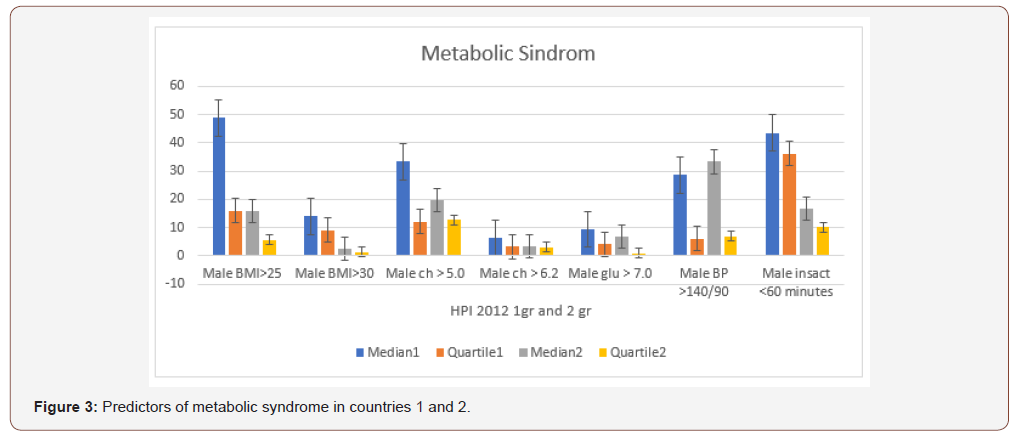
Table 3: Examine the effects of risk factors (explanatory variables) on cardiovascular morbidity (dependent variable) using predictive multiple linear regression analysis.
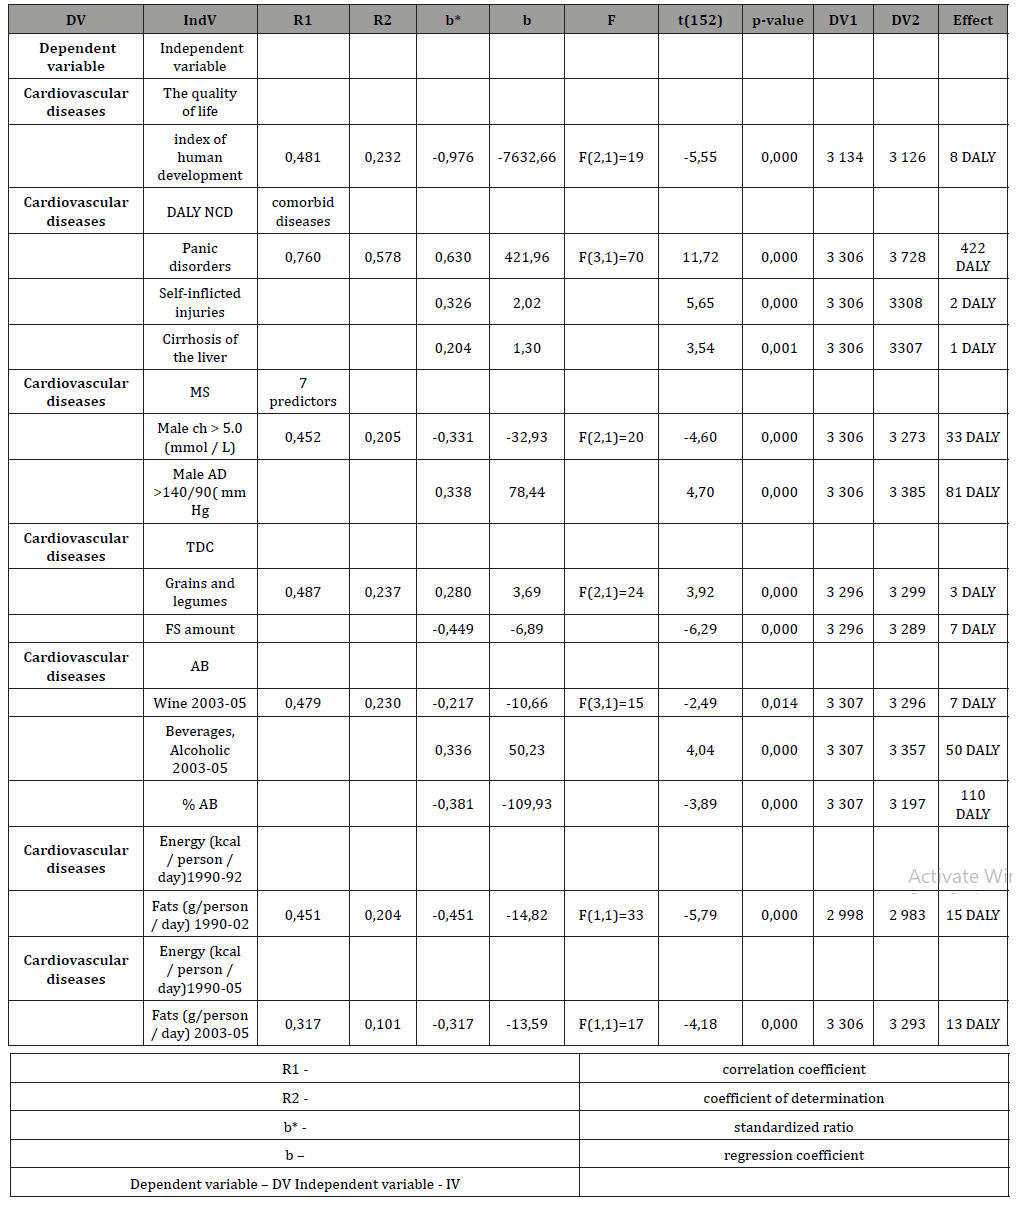
From the group of characteristics the quality of life, the independent variable Index of human development (IHD) (R1 - 0.4814 and R2 - 0.232) (p ≤ 0.003) had the greatest influence on CVD. An increase in IHD per unit was accompanied by a decrease in 8 DALYs burden CVD (Table 3). Of the 4 predictors of MS CVD was most influenced by the independent variables chol> 5.0 (mmol / L) and BP> 140/90 (mm Hg (R 1 = 0.452, R 2 = 0.205) (p ≤ 0.001). measurement of hyperlirademia was accompanied by a 33 DALY burden CVD decrease. was accompanied by an 81 DALY increase in the dependent variable burden CVD (Table 3).
From the group of daily food consumption levels (TDC), the greatest influence on the dependent variable burden CVD was exerted by Grains and legumes and FS amount (R1 = 0.487; R2 = 0.237) (p ≤ 0.001). A unit increase in the independent variable Grains and legumes was accompanied by an increase in the dependent variable burden CVD by 3 DALYs. A unit increase in the independent variable FS amount was accompanied by a decrease in CVD burden by 7 DALYs (Table 3). From the group of daily consumption levels of alcoholic beverages (AB), the independent variables Wine, Beverages, Alcoholic and% AB (R1 = 0.479; R2 = 0.230) (p ≤ 0.002) had the greatest influence. Increases per unit of independent variables Wine, Beverages, Alcoholic and% AB were accompanied by a decrease in CVD burden by 7 DALYs. an increase in burden CVD by 50 DALYs and a decrease in burden CVD by 110 DALYs, respectively (Table 3).
Of the independent variables: Energy, Proteins, and Fats, the independent variable Fats (g / person / day) (R1 = 0.4512; R2 = 0.204) (p ≤ 0.001) had the greatest effect on the dependent variable burden CVD. A unit increase in the independent variable Fats caused a 15 DALYs decrease in CVD burden (Table 3).
Analysis of the daily levels of products in the 1st and 2nd group of countries
The total daily food consumption (TDC) in the 1st group of countries was 2 times higher than in the 2nd group of countries (p ≤ 0.001) (Table 4). Consumption of products of animal origin (AP amount) in the 1st group of countries was 2.2 times higher than the 2nd group of countries (p ≤ 0.001). Consumption of grains and vegetables (GV amount) in group 1 was 1.6 times higher than group 2 (p ≤ 0.001). Consumption of fruits and sweeteners (FS amount) in group 1 was 5 times higher than group 2 (p ≤ 0.001). Consumption of alcoholic beverages (AB amount) in the 1st and 2nd groups of countries did not differ statistically (p = 0.08).
But the average indicator was 3 times higher in group 1
The energy of animal products (AP amount) was 3 times higher in the 1st group of countries (p ≤ 0.001). The total energy consumption was 1.3 times higher than the 2nd group of countries (p ≤ 0.001) (Table 4).
The Discussion of the Result
In accordance with the set goal and objectives, the conducted studies found that in happy countries, in comparison with unhappy ones, the per capita income was 4 times higher and the happiness index was 3 times higher. In happy countries, the quality of life was on average 3 times higher, prosperity and health were 1.6 times higher. Life expectancy was 23 years higher in happy countries. This was consistent with the data of other authors [29]. A high quality of life and income ensured a higher (in 2 slots) level of food consumption in happy countries. In the happy countries, the consumption of red meat, pulses, fruits was 3 times higher and the consumption of hard alcohol was 9 times higher. As a result of the higher consumption of individual foods in the happy countries, they consumed 2 times more energy from animal products and 1.3 times the total energy. High consumption of foods and nutrients in happy countries was accompanied by higher (2 times) indicators of predictors of metabolic syndrome. In happy countries, there were 2.5 and 4 times more men with overweight and obesity, 2 times more men with hyperlipidemia, hyperglycemia and low physical activity.
Table 4: Predictors of metabolic syndrome in countries 1 and 2.
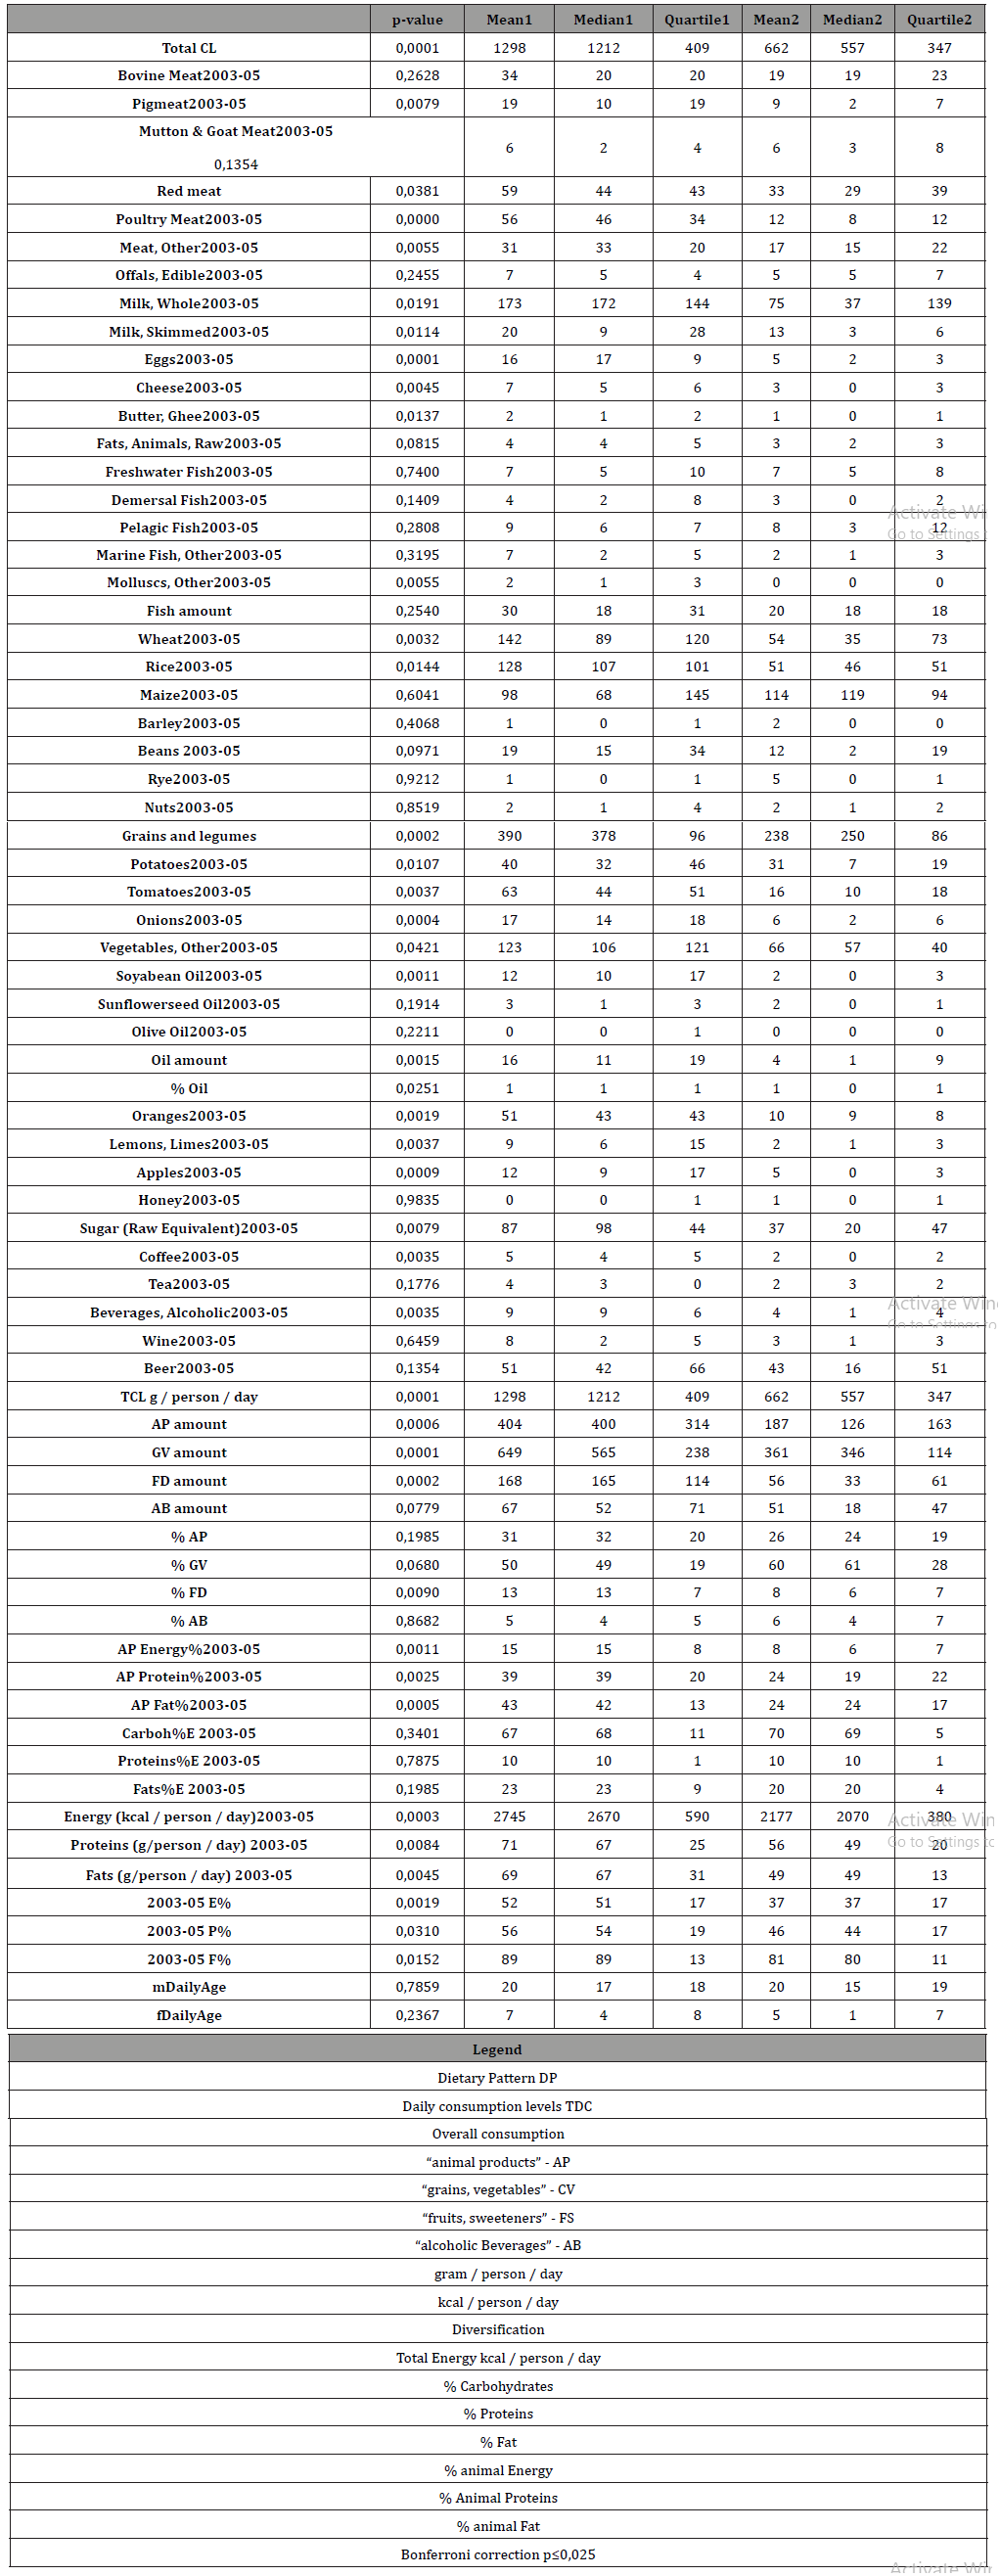
Obesity has been shown to be an important risk factor for NCDs, including cardiovascular disease and cancer [30,31]. However, in happy countries, there were 1.2 times fewer men with high blood pressure. Happier countries consistently report lower levels of hypertension. This not only potentially confirms differences in the measurement of happiness across countries, but also suggests that blood pressure readings can be valuable as part of a national well-being index [32]. In our studies in happy countries, the burden of cardiovascular disease was 1.5 times lower than in unhappy countries. In happy countries, in comparison with unhappy ones, there was a lower overall mortality and overall morbidity. This was consistent with the results of other researchers [33].
The results of our studies were similar to those published by us earlier [14]. In [14], we used the 2016 Happiness Index. The income of the happy countries was 20 times higher than that of the unhappy countries [14]. The burden of cardiovascular disease in happy countries was 2.6 times lower than in unhappy countries. Predictors of metabolic syndrome and food consumption levels were 4 times higher in the happy countries [14]. The results of our study of multiple linear regression analysis models showed that an increase per unit of measure (1 DALY) in independent variables of comorbid diseases: the burden of panic attacks, suicide, or cirrhosis of the liver, may be accompanied by an increase in the burden of cardiovascular diseases (dependent variable) by 422, 2 and 1 DALYs, respectively (p≤0.001).
An increase per unit of measurement (1 g) in red wine consumption was accompanied by a decrease in the burden of cardiovascular disease by 7 DALYs (p≤0.001). But an increase in hard alcohol consumption by (by 1 g) caused an increase in the burden of cardiovascular diseases by 50 DALYs (p≤0.001). A similar effect was caused by an increase in the consumption of pulses by (by 1 g). The burden of cardiovascular disease in this case increased by 3 DALYs (p≤0.001). At the same time, an increase in fruit consumption (by 1 g) is accompanied by a decrease in the burden of cardiovascular diseases by 15 DALYs (p≤0.001). Thus, as a result of our research, it has been established that the risk factors for the burden of cardiovascular diseases, apparently, are a low Happiness Index, a low quality of life, and a high consumption of strong alcohol and carbohydrates.
Modern research in the prevention of cardiovascular diseases recommend lifestyle changes, the transition to a healthy diet; maintaining a low body mass index; to give up smoking; and regular physical activity of moderate intensity [34]. Our studies in recent years indicate that risk factors for NCDs are not unambiguous for the main NCDs, which make up almost 80% of NCDs [14,35,36]. Currently, there is no consensus in society regarding the harm and benefits of consuming alcoholic beverages [37-39]. According to Aristotle, the more emotions we want to experience, the happier we are. Happiness involves experiencing emotions that feel right, regardless of whether people feel good [40].
It has been shown that positive emotions in early and middle adulthood are associated with improvement in cardiovascular diseases over several decades. Baseline cardiovascular disease was also associated with stronger positive emotions during followup [41]. The relationship between 2 different aspects of positive well-being was studied: affective well-being and eudaimonia with the progression of aortic stiffness, an indicator of subclinical cardiovascular disease. Higher eudemonic well-being by 1 SD was associated with lower baseline progression of aortic stiffness in males (β = -0, 100 m / s [95% CI = -0.169 to -0.032]), regardless of social, behavioral and biological factors. In older men, higher levels of eudemonic well-being were associated with lower long-term levels of arterial stiffness.
These results support the notion that the model of the relationship between positive well-being and cardiovascular health outcomes includes eudemonic rather than affective well-being and is gender-dependent. (Eudemonic well-being is a quality of life that manifests itself in the development of personal potential, personal expressiveness and internal determination) [42]. Feelings of happiness, sadness and negative life events were associated with the diameter of the retinal vessels. high levels of psychosocial stress in childhood adversely affect the diameter of the retinal vessels, potentially reflecting the microvessels of the heart and brain [43].
A higher BMI has been found to be associated with lower subjective well-being. this research provides additional motivation to combat the obesity epidemic by pursuing subjective well-being [44]. It was found that in acute coronary syndromes, especially in acute myocardial infarction, patients with non-alcoholic fatty liver disease have a poor prognosis compared to patients without nonalcoholic fatty liver disease [45]. A study of mortality data from 1969 to 2014 concluded that by 2020 the number of deaths associated with heart disease will decrease by 21.3% for men and 13.4% for women. It can be assumed that the forecasts will come true. Heart disease significantly depends on GDP, which is growing steadily in developed countries [46]. It can be concluded that the Happiness Indices open up new possibilities for studying the mechanisms of influence of risk factors on CVD and NCD.
Conclusion
Countries with a high Happiness Index have been found to have lower overall mortality and morbidity and a lower CVD burden compared with a low Happiness Index due to higher quality of life, better health care and food security. The index of happiness can be considered a subtle and sensitive tool for assessing not only social life, but also human health.
To read more about this article...Open access Journal of Cardiology Research & Reports
Please follow the URL to access more information about this article


No comments:
Post a Comment