Authored by Fernando Miralles-Wilhelm*,
Abstract
This investigation introduces remote sensing (RS) methods for monitoring of water quality in support of measuring, understanding, and managing impacts in sensitive water bodies. In addition to providing a baseline assessment of water quality at select locations over time, these methods can be used to rapidly assess changes in water quality conditions resulting from socioeconomic conditions introduced by local and regional response to the Covid-19 pandemic and associated lockdowns. This RS methodology developed for this study was implemented in 4 major water bodies across the region of Latin America: Guanabara Bay in Rio de Janeiro, Brazil; Lake Titicaca in Bolivia and Peru; Ypacarai Lake near Asuncion, Paraguay; and the Rio Reconquista Basin near Buenos Aires, Argentina. The most significant changes that were observed, in relation to the Covid-19 restrictions, generally occur in areas directly adjoining or downstream from densely populated areas. For example, in Rio de Janeiro (Guanabara Bay), significant differences in water quality were observed at several locations in Guanabara Bay (Rio de Janeiro) corresponding to a timeframe generally coincident with Covid-19 lockdown measures. In Lake Titicaca, significant differences in WQ metrics coincident with Covid-19 lockdown measures have also been observed at several locations. Primary lockdown measures in the Buenos Aires region between March and July 2020 appear to precede the increased Chlorophyll-a concentrations across several analysis locations during Dec 2020 & Jan/Feb 2021, which could be indicative to higher untreated or partially treated wastewater production during the lockdown period. In Ypacarai Lake, there were no statistically significant changes observed in water quality parameters pre- and post-Covid-19 lockdown measures at any of the study locations. Remote Sensing applied to monitoring of water quality in lakes, rivers and reservoirs is a valuable emerging technology that can provide geospatial information about water clarity, nutrient, bacterial and industrial pollution from urban and rural sources. The methodology presented in this paper using cloud computing allows rapid monitoring deployment and scalable coverage across numerous watersheds and geographies. Although this paper presents a comprehensive analysis of this entirely new source of water quality data across the sites and locations of interest, a more detailed analysis can be performed by looking at different timeframes (e.g., entire data set or monthly aggregates) within these watersheds. Additional insights may be unraveled by further combining the water quality data sets of this work with other sources of information including local sensors, information from water and sanitation utilities and a more detailed analysis of the timing of location conditions and their local impacts.
Introduction
This investigation introduces remote sensing (RS) methods for monitoring of water quality in support of measuring, understanding, and managing impacts in sensitive water bodies. More specifically, this study pilots the use of a satellite-imagery-based data collection and processing that operationalizes the creation of locationspecific water quality (WQ) data sets, which has not been generally available until now. In addition to providing a baseline assessment of water quality at select locations over time, these methods can be used to rapidly assess changes in water quality conditions resulting from socioeconomic conditions introduced by local and regional response to the Covid-19 pandemic and associated lockdowns.
The monitoring and analytical tools demonstrated here provide decision makers and stakeholders with a new comprehensive measurement basis and historical trends that can be used to inform impact or progress monitoring for existing projects and further water and sanitation investments aimed at improving water quality. Importantly, this study also provides a retrospective dataset against which the economic effects felt by varying Covid-19 lockdown measures can be compared. The data sets resulting from this demonstration can further be compared with other socioeconomic, land-use and water and sanitation utilization data sets to assess both the near term, event-based changes such as onset of Covid-19 restriction measures, or longer-term impact assessments.
The methods used allow for easy-to-scale and systematic monitoring, analytics, and reporting for water quality stakeholders, increasing efficiency in tactical and strategic decision making. The specific focus of this study is to develop an automated RS data processing chain enabling detection of phytoplankton abundance (chlorophyll-a) as a proxy for pollution by organic and inorganic nutrients, as well as sediments (and turbidity or water ‘clarity’). These water quality parameters are typically driven by land-erosion and runoff processes and also often contain other pollutants from urban environments such as untreated or partially treated sewage or effluent. Excess nutrient loading, and urban runoff and wastewater pollution due to inadequate sanitation are representative of major water quality issues worldwide.
The data production was tailored to specific reservoir, river, and estuarine systems of interest to stakeholders and thus provides a comprehensive analysis and dataset for a suite of water quality parameters. Additionally, this research leverages the historical remote sensing data archives to provide a baseline trend and variability assessment for water quality within these watersheds.
This RS methodology developed for this study was implemented in 4 major water bodies across the region of Latin America: Guanabara Bay in Rio de Janeiro, Brazil; Lake Titicaca in Bolivia and Peru; Ypacarai Lake near Asuncion, Paraguay; and the Rio Reconquista Basin near Buenos Aires, Argentina.
Methodology
Remote sensing datasets
At the core of this pilot study is a dense satellite time series dataset continuously collected over each of the four sites since early 2016. The two Sentinel 2 satellites orbit asynchronously to provide a new image of a location on the earth’s surface every 5 days at the equator (2-3 days at the mid-latitudes). Each image has 13 unique spectral bands available in a resolution of 10-60m, depending on the band.
These multi-spectral images provide a snapshot of the earth’s surface beyond the visible red, green, and blue spectral bands available from a typical consumer-grade digital camera image. For example, the amount of water present in vegetation canopies can be calculated using spectra invisible to the human eye, the near infrared, and shortwave infrared bands on Sentinel 2A (8A, 11, and 12).
Satellite imagery datasets are acquired from the European Space Agency’s Sentinel 2 A & B platforms, which can produce a high-resolution (10-20 m) multispectral (490-865 nm) image at the same location on Earth every 5 days. These imagery data are distributed free for public use and are used as the starting point for the satellite data processing methodology. This methodology ingests the raw top-of-atmosphere imagery, corrects for atmospheric effects, calculates a suite of WQ metrics, and creates a data repository for use across different display and analysis platforms. For this study, three different WQ metrics are calculated and used for the assessment of each water body.
Chlorophyll-a measures the concentration of phytoplankton growing in the water and is expressed in milligrams per cubic meter (mg/m³). Water quality problems associated with changes in this water quality parameter are typically caused by nutrient pollution.
Turbidity measures the optical clarity of the water and is supplied in Formazin Nephelometric Units (FNU).
Suspended Matter measures the concentration of fine particles, both inorganic and organic, that are suspended in the water and is supplied in units of grams per cubic meter (g/m³). Water quality problems associated with changes in this water quality parameter are typically caused by sediment pollution.
All resulting WQ product datasets are georeferenced, cloudscreened, and adjusted to account for localized water extent changes over time.
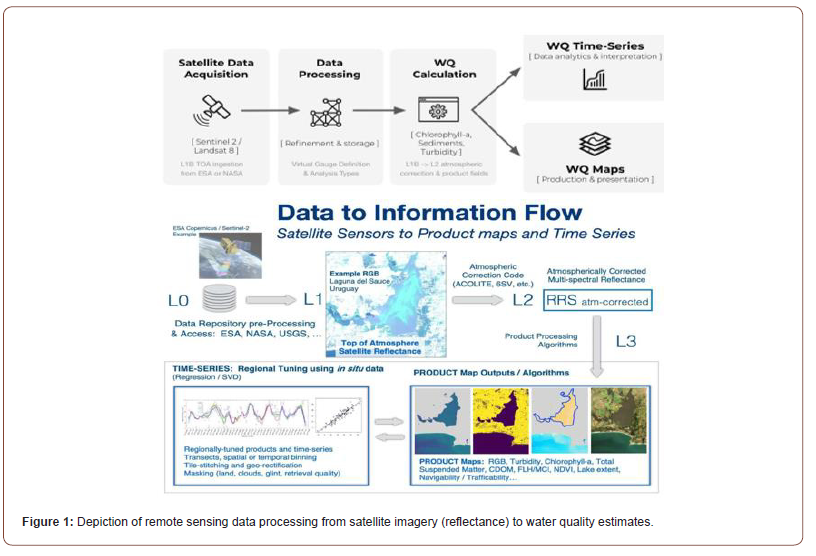
Adaptation of NASA’s Ocean color radiometry
Figure 1 illustrates the basis of the methodology used for processing of remote sensing observations into water quality estimates. NASA and other space agencies have established protocols for how this is done and following NASA nomenclature these top-of-atmosphere corrected images are referred to as processing level “L0”.
To make these images useful for calculating water quality parameters, the images must undergo a process that removes the effects of the atmosphere present between the satellite sensor and the earth or water surface. This process, termed atmospheric correction, implements a series of algorithms to reduce or eliminate the effects of atmospheric absorption and backscatter on the image, yielding a more accurate representation of the earth’s surface. The resulting images contain values for the remote sensing reflectance (abbreviated as Rrs) of the water body, which are referred to as “L1” in the commonly adopted NASA nomenclature. These processed images can then be used to derive a variety of data products.
Reflectance data processing approaches commonly rely on atmospheric correction processes based on open-source methods developed for inland and coastal water applications, such as the Royal Belgian Institute of Natural Sciences’ (RBINS) Acolite processor, the National Aeronautics and Space Administration’s (NASA) SeaDAS processor. The full image collections, also referred to as archives, containing the atmospherically corrected imagery and Rrs values, are used to calculate the three water quality (WQ) products in this pilot study; Chlorophyll-a, suspended matter, and turbidity concentrations.
We derived the following WQ products are obtained by applying relatively standard algorithms developed in the open scientific literature specifically for detecting the makeup of inland coastal waters.
a) Chlorophyll-a concentrations, which are measured in milligrams per cubic meter (mg/m³), are calculated using normalized difference chlorophyll index (NDCI) developed by Mishra (2012).
b) The NDCI algorithm can be used to detect algae concentrations and blooms using the red and red-edge spectral bands.
c) Suspended matter and turbidity concentrations are measured in grams per cubic meter (g/m³) and Formazin Nephelometric Units (FNU), respectively, and are both derived from the methodology developed by Nechad B, et al. [1] for detecting total suspended matter (TSM) concentrations on the water surface.
It is important to note that the data in this research is not calibrated or validated against ground measurements, due to inconsistent availability of water quality data across the four study sites. The analyses used in this pilot study relied on the pixel-wise time series data extracted from the entire water surface across each site. Having datasets that were dense in both the spatial (10 m pixels) and temporal (1 new image roughly every 5 days) dimensions facilitated analyses that could focus on establishing WQ baselines, quantifying changes in temporal trends, and illustrating patterns in spatial distributions. Trends over time and within seasons were established using simple time series plots constructed from the average or median WQ data product value across the entire water surface or else constrained to Virtual Gage locations. Moving average filters were applied to time series data to both smooth spikes and interpolate across small gaps.
Spatial and temporal data analyses
Virtual gages: A Virtual Gage is a specific geographic region of interest in which water quality parameters are temporally assessed in greater detail than viable across the entire water body. The goal of establishing Virtual Gage locations is to extract data that enables rapid, flexible, and relevant investigation into areas where known WQ issues exist. Virtual gages are well defined points or areas of interest on a data map.
To establish a Virtual Gage location, we first collected information from local experts and the scientific literature about where WQ issues originate or tend to occur. Examples of this information include official WQ sampling locations, citizen science reports, known point source polluters, areas where rivers are input into a reservoir, or locations of critical infrastructure (e.g., drinking water or hydropower intake locations). Then, a spatially referenced area is created that reflects both the research and a statistically relevant pixel sample size. In this way, virtual gages allow us to generate time series for any point or area that is of interest on the data maps, as if we had placed a gage there physically.
Virtual Gage locations were placed in areas close to densely populated regions and at least 50 meters across in rivers. Those at Ypacarai Lake were selected with a focus on being directly downstream from densely populated areas where tourism dominates (Virtual Gages 2 & 4), as well as at the natural in-flow and out-flow locations (Virtual Gages 1 & 3). At Guanabara Bay, Virtual Gages were established at the major outflow points from heavily populated and polluted waterways (Virtual Gages 1, 2, 3, 4), as well as at points where natural flow patterns can be observed (Virtual Gages 4 & 5). In Rio Reconquista Basin, Virtual Gage locations 1, 2, & 3 were selected because they can summarize in-flow/out-flow activity within the Rio Reconquista basin, while Virtual Gages 4 & 5 were used as auxiliary measures of activity in the adjoining basins within the Buenos Aires metropolitan area. At Lake Titicaca, all Virtual Gages were established based on being downstream from some significant population, as well as being located within the shallower and geographically isolated bays that characterize the lake.
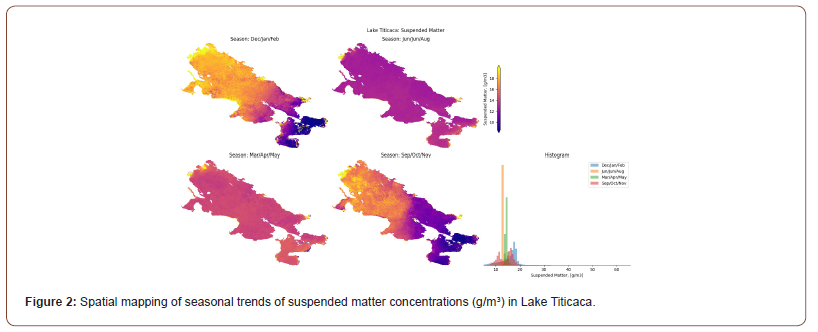
Seasonal trends: To better understand the seasonal effects on water quality parameter values, we created maps illustrating the average seasonal changes across the entire water body. This approach is illustrated in Figure 2. First, water quality values across the full archival time series were grouped into three-month intervals: December through February, March through May, June through August, and September through November. Then values were averaged through time to produce maps that highlight the seasonal differences. This allows for identifying periods during the year or location within the water body where trends are noticeable, providing a method to link hydrological and land processes, or prevailing meteorological conditions. Seasonal and meteorological drivers not only impact the urban and rural runoff but can influence the hydrodynamics (water mixing) including flooding, storm surge, sewage flows and light available for photosynthesis, and more generally photochemical processes within the watershed.
To further illustrate the differences within seasons and across years, we plot water quality time series data split by each year. Plots are produced for the entire water body as well as for each Virtual Gage location. Such plots can be produced for sub-regions of a waterbody or specific Virtual Gage locations, as shown in Figure 3.

Temporal statistics of water quality changes from covid-19 lockdown: Changes to WQ stemming from Covid-19 lockdown restrictions were assessed from remote sensing data using a series of simple one-way analysis of variance (ANOVA) tests (see Figure 4). Differences in pre- and post-Covid-19 conditions were tested for at each WQ metric at each virtual gage location, with pre-Covid-19 lockdown defined as all-time series data before March 19, 2020. While the timing and length of lockdown measures varied across the sites, a general assumption that lockdown measures ebbed and flowed starting in March 2020 combined with a seasonally based division of data allowed for an as accurate as possible approach to comparing pre- vs. post-Covid-19 trends. Both pre- and post- Covid-19 datasets were separated into three-month seasons, with tests performed on each season to control for seasonal variations. Significant differences between conditions were recorded with a ‘p-value’ less than 0.05.
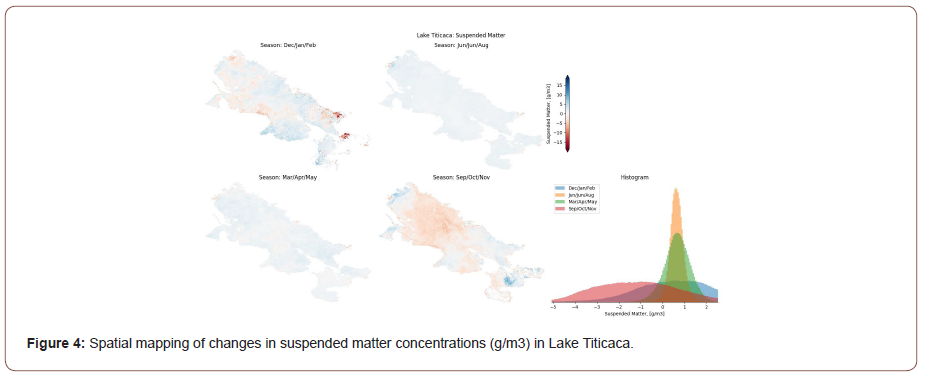
Separately, an assessment of Covid-19 lockdown related differences in WQ was conducted across the entire water body to illustrate general trends not associated with virtual gage locations. For this, pixel-wise differences were calculated across the entire water body using images down sampled to 30 m pixels. The resulting images illustrate where changes in WQ are observable. Here the pixels where statistically significant differences that coincide with the period pre and post onset of Covid-19 are color coded; blue areas indicate locations where an increase in the water quality parameter is observed and red indicates areas where the specific water quality parameters are lower. As expected, these changes have some seasonal patterns that could be enhanced by seasonal environmental differences or the timing and severity of lockdown requirements and resulting changes in economic activity.
Long term trends (Mann Kendall trend test): Quantifying the direction and magnitude of trends in the time series data is
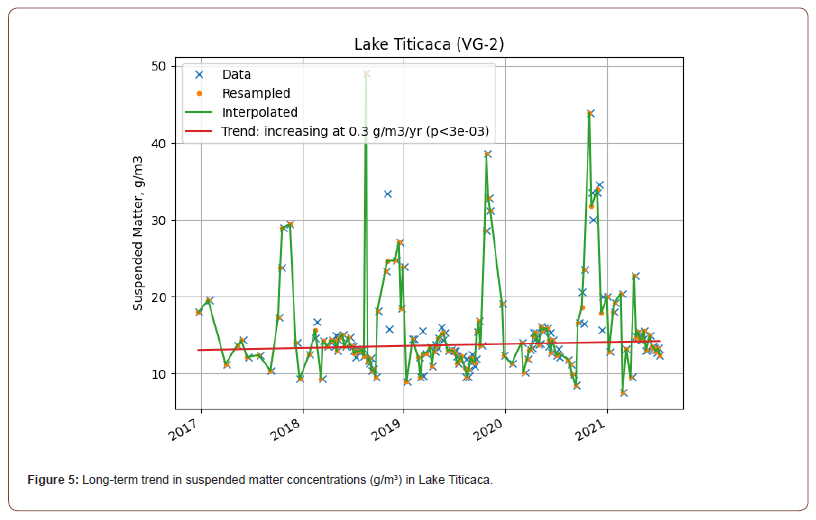
important to contextualizing any significant annual fluctuations. To do so a seasonally adjusted Mann-Kendall trend test was used to assess the presence, direction, and magnitude of a trend in the larger time series. Mann-Kendall tests are used to look through an entire dataset and quantify whether there is a significant fundamental change in the trend, regardless of the nature of the data distribution (i.e., no assumptions for a normal distribution) or linearity of the trend (i.e., it could be a non-linear trend). Seasonally adjusted Mann-Kendall trend tests were applied to each WQ dataset averaged across each Virtual Gage location. The results quantified the long-term behavior at each Virtual Gage location and helped differentiate the dynamics at locations where water inputs and outlets occurred.
The procedure used and its results is illustrated in Figure 5. First, the median water quality parameter value is calculated across a Virtual Gage location for each image date. Then, a Mann-Kendall test is applied to the full archival time series which provides the direction, magnitude, and statistical significance of potential trends at that location. The outcome indicates whether the time series data at that location has a consistent increasing or decreasing trend. This statistical assessment is particularly useful to understand the underlying variability and longer-term trends at specific locations in which the Covid-19, event-driven changes, are observed.
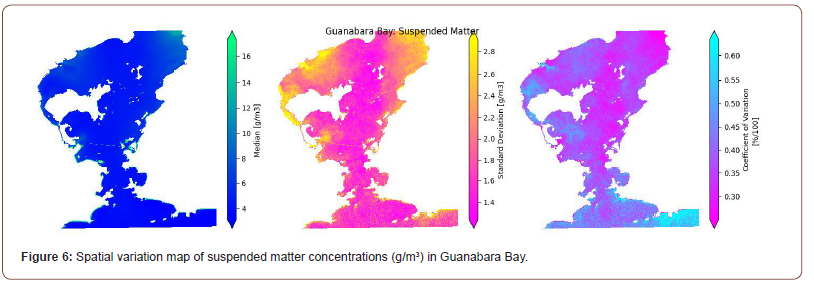
Spatial variation maps: To quantify where water quality values are consistently high, low, and have high variability over time, we created spatial variation maps for each water body and water quality parameter (see Figure 6). This process calculates the median, standard deviation, and coefficient of variation on a pixelwise basis through time. The product is a map that shows the spatial distribution of these summary statistics through time. These maps can be used to locate areas that stand out with consistently different water quality patterns or areas with high variability. Either of these areas could be locations that are valuable indicators of important processes or can be used as locations for more detailed monitoring.
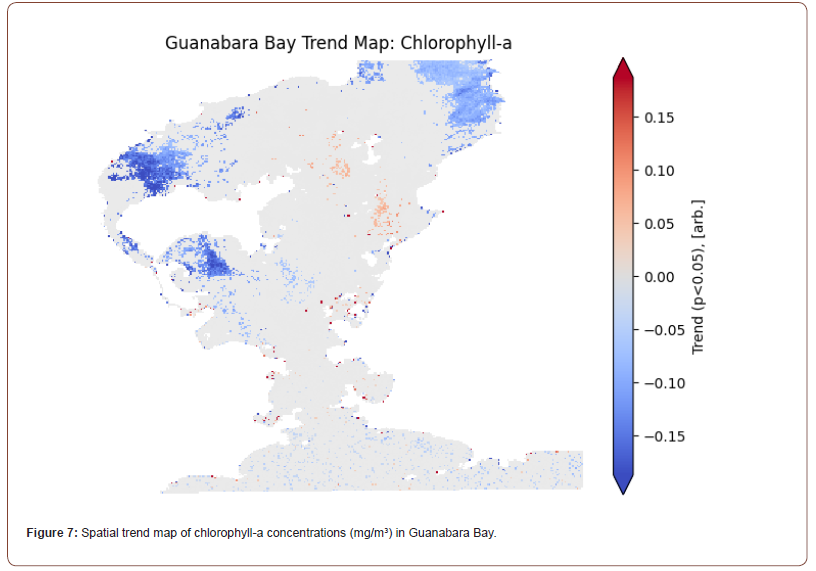
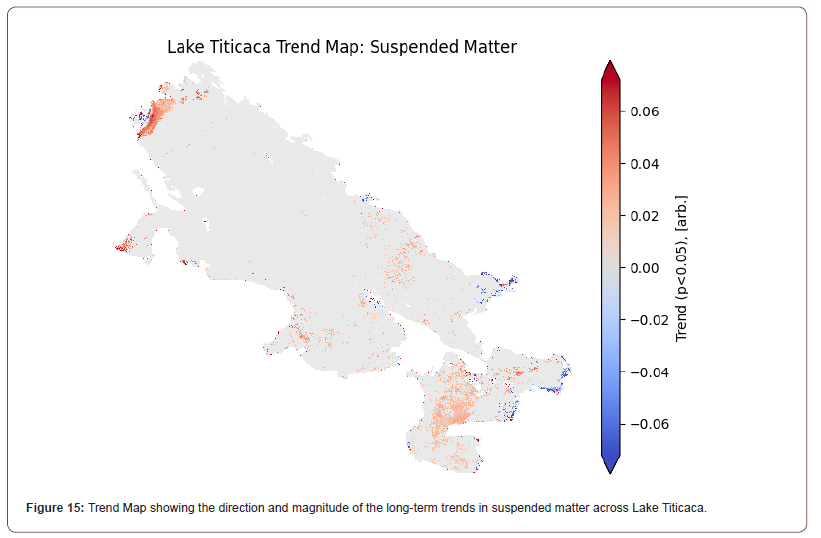
Spatial trend maps: Next, extending the concept of spatial variation maps, we create spatial trend maps to visualize where temporal trends in water quality parameters are occurring (Figure 7). First, data across the entire water body is spatially binned by averaged to approximately 100m resolution. Then, a linear regression is applied along the temporal axis for each bin; a threesigma outlier filtering process is used to remove outliers. Finally, the linear trends are visualized on a map where statistically significant (p-value below 5%) values are colorized based on direction and intensity. Similarly, to the Spatial Statistics maps, colorized areas can be used to understand areas or locations where long-term trends indicate a linear trend in underlying water quality over multiple years showing increasing environmental pressures on the ecosystems, or successful implementation of policies, land-use practice or water and sanitation projects.
Results and Discussion
Guanabara Bay
Guanabara Bay is a 384 km² area surrounded by several of Brazil’s major metropolitan areas and roughly 8.6 million people, many of whom reside in the city of Rio de Janeiro. About 84% of the bay is less than 10m deep, with the remaining portion a deep main channel that leads out to the Atlantic Ocean; these properties in turn hamper the internal circulation of the water within the bay [2]. Significant land-use change away from the natural estuarial ecosystems to heavy industrial and residential has led to widespread ecological degradation in water quality in the bay [3,4]. Unfiltered organic waste from sewage outfalls draining dense residential development has led to severe eutrophication and a significant decline in marine life [5,6]. High Chlorophyll-a levels tend to be observed at locations draining dense residential and industrial development, which correspond to Virtual Gage locations 1, 2, and 3 (Figure 8). Patterns at these locations also follow a seasonal trend, with higher concentrations occurring during the warmer and wetter months, especially November through March for locations 2 and 3 during a period of higher solar radiation in the southern hemisphere. This data set could be used to design a monitoring plan to better understand the key sources of nutrients and organic matter resulting in eutrophication.
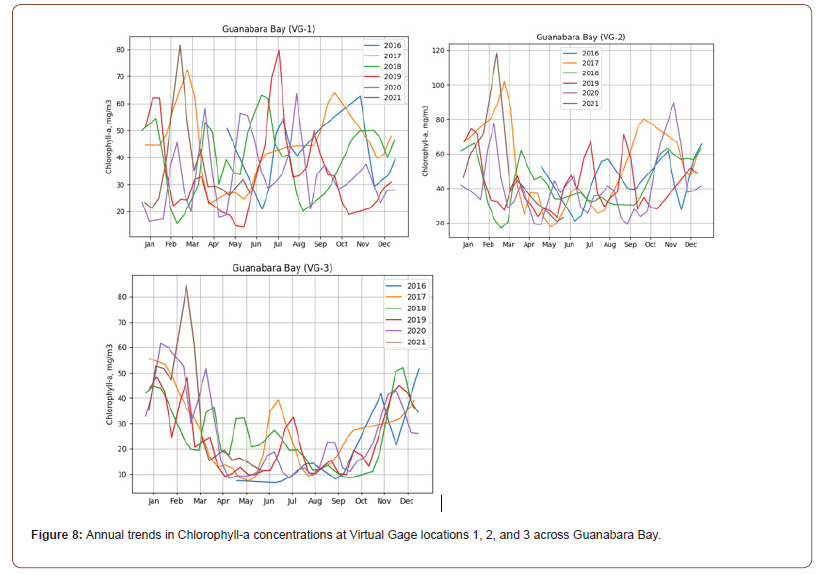
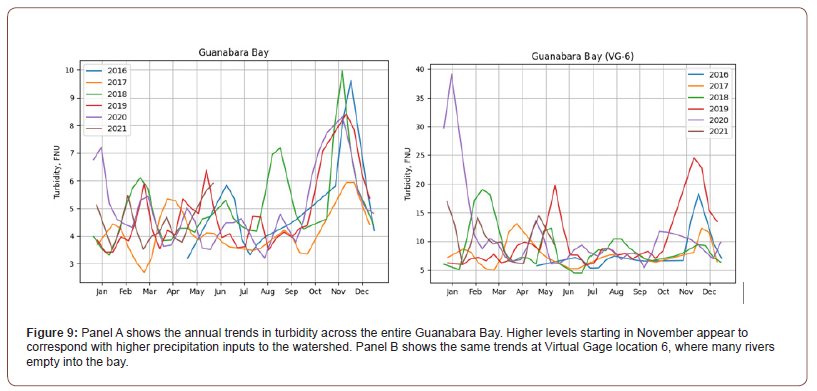
This shows a strong seasonal pattern where algae blooms are prevalent in the southern hemisphere summer, and higher amounts of photosynthetic radiation and higher nutrient runoff. As an outlet for several major unobstructed rivers, annual trends in turbidity and suspended matter concentrations align with the rainiest months, from December to March, and are particularly noticeable at Virtual Gage location 6 (Figure 9).
There were significant differences in WQ metrics that correspond with the general timing of Covid-19 lockdown measures at several Virtual Gage locations in Guanabara Bay. Lockdown measures affecting Rio de Janeiro were limited to the month of May 2020 for the context of this study. Overall, there were few instances of statistically significant changes in WQ metrics at Virtual Gage locations (Table 1), however significant trends at these locations are further observed and corroborated across the entire water surface (Figure 10). In particular, post Covid-19 lockdown conditions show overall reductions in Chlorophyll-a concentrations across much of Guanabara Bay, with significant reductions at Virtual Gage locations 1 and 6. Reductions in Chlorophyll-a concentrations at Virtual Gage 1 at the location of the outlet of the heavily polluted Rio Iguacu, could be caused by changes in industrial and residential discharges at varying stages of lockdown restrictions. However, at Virtual Gage location 4, the increase in Chlorophyll-a concentrations during the active lockdown period (Mar/Apr/May 2020) could be tied to increased residential effluent from people being at home. Table 1 summarizes the locations with statistically significant (p < 0.05) differences between pre and post Covid-19 lockdown measures, with the site-wide differences illustrated in maps of the entire water surface across the site (Figure 10).
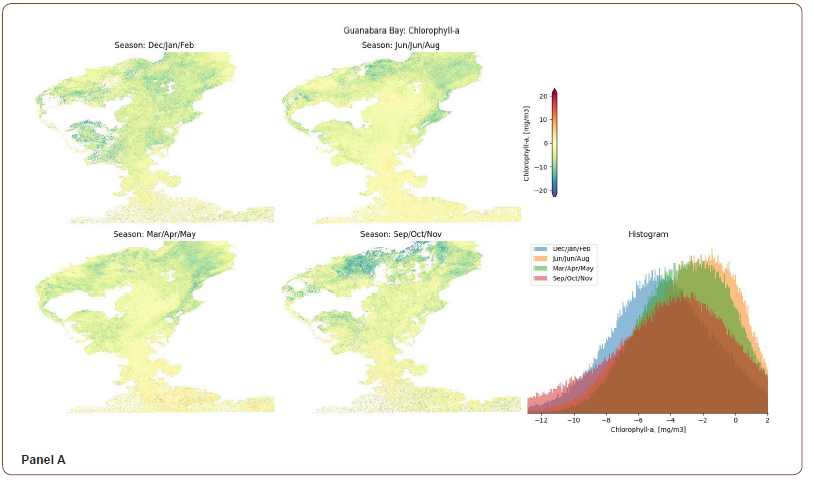
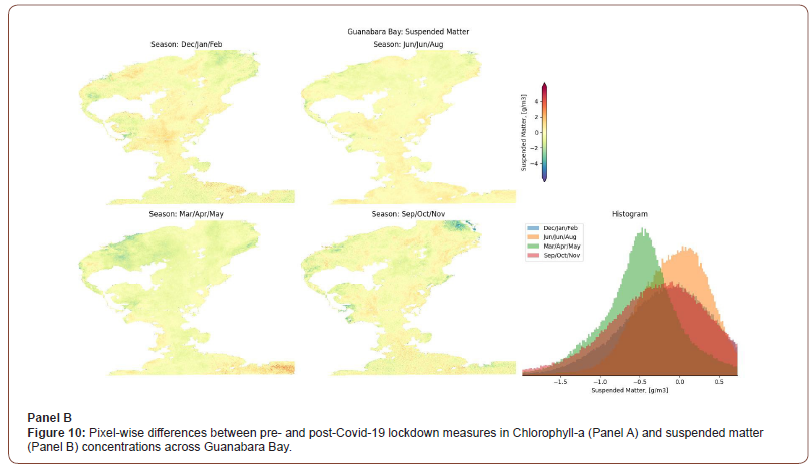
Table 1:Changes in WQ metrics at Virtual Gage locations in Guanabara Bay.

Overall, Figure 10 indicates that Chlorophyll-a concentrations appear to significantly decrease across the entire bay throughout Covid-19 onset and lockdown timeframe, which could indicate generally lower nutrient levels across the bay. However, due to size and complexity of the inputs into the bay, pinning down the origin of these changes is less straightforward, and requires narrowing the analysis to areas where local and more detailed understanding of restrictions in place during Covid-19 in concert with demographic and economic geospatial data. More variable conditions along the western shoreline near Rio de Janeiro suggest that effects from lockdown measures can be localized and may be dependent on the enforcement of and compliance with restrictions in these areas, coupled with quality of water and sanitation infrastructure in those locations. In particular, the area near Virtual Gages 1 and 2 has opposing patterns in suspended matter concentrations between March/April/May and December/January/February. The decrease in suspended matter concentrations during March/April/May (2020) appears to correspond with the official lockdown period in Rio de Janeiro (May 5 - May 24, 2020). Decreased suspended matter concentrations during this time may correlate with decreased industrial wastewater output, while the increases later on during December/January/February (2021) points to relaxed lockdown measures and increased activity.
Lake Titicaca
As the largest freshwater lake in South America, Lake Titicaca is integral to the high plateau regions of Peru and Bolivia where much of the population is dependent on the lake for cultural, agricultural, and economic activities. Increased untreated outflows from industrial and residential development have compromised larger ecosystem health and led to bi-national government programs aimed at implementing sanitation projects at key places around the lake [7]. In particular, the shallower areas in the southern (Rio Katari outlet), far western (Puno Bay), far eastern (near Achacachi), and northern portions (Rio Ramis) all are subject to decreased water quality and algal blooms [8,9]. Consequently, higher Chlorophyll-a concentrations are observed at Virtual Gage locations that align with these shallower areas (Figure 11). Interesting to note is the strong seasonal variation at some locations, while others remain consistent throughout the years. Both the strong variation and consistency at these locations could be in part to wind-driven water circulation patterns from the winds predominantly being from the north and west. Similarly, these patterns are observed in turbidity and suspended matter concentrations at the same Virtual Gage locations (Figure 12).
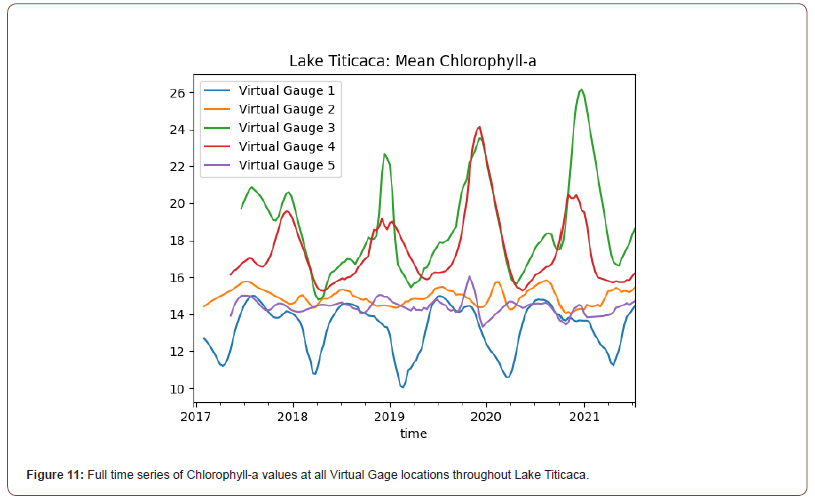
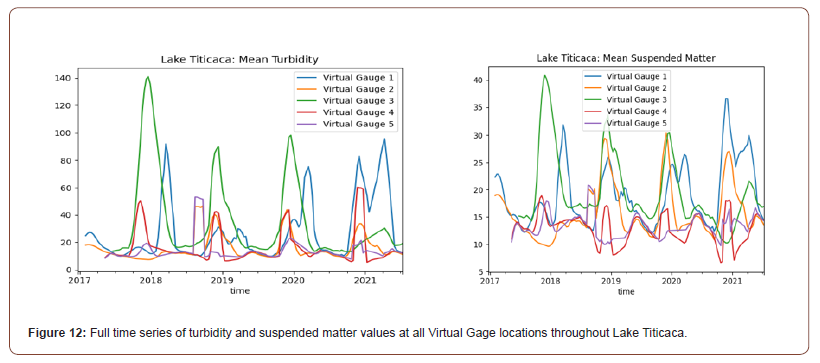
The strong seasonality in Virtual Gages 1, 3, and 4 could in part be due to their locations downstream from significant population centers and the increased organic pollutants that might be running off from these locations and contributing to higher Chlorophyll-a concentrations from algal blooms. The lack of strong seasonal signals at Virtual Gage locations 2 and 5 could also be in part due to lower nutrient levels. In these locations, there is likely less winddriven movement on the water surface, since the predominant wind direction is out of the west, which typically creates conditions well suited for surface algal bloom formation.
During the latter part of 2020 and into 2021, turbidity and suspended matter concentrations at Virtual Gage location 3 decreased to below normal levels. This decrease also mirrored an increase in Chlorophyll-a concentrations at that same location. This perhaps indicates that limited industrial activity contributed to a reduction in runoff while increasing the likelihood of algal growth in clearer waters.
In the Lake Titicaca region, the only official Covid-19-related lockdown measures were in effect in La Paz/El Alto (Virtual Gage location 4) during April-May 2020. There were significant differences in WQ metrics observed from Covid-19 lockdown measures at several Virtual Gage locations in Lake Titicaca (Table 2), however significant trends at these locations are further observed and corroborated across the entire water surface (Figure 13). In particular, post Covid-19 conditions show isolated areas with clear changes in WQ metrics, and these areas tend to be downstream from the larger population centers in La Paz, Achacachi, Desaguadero, and Puno.
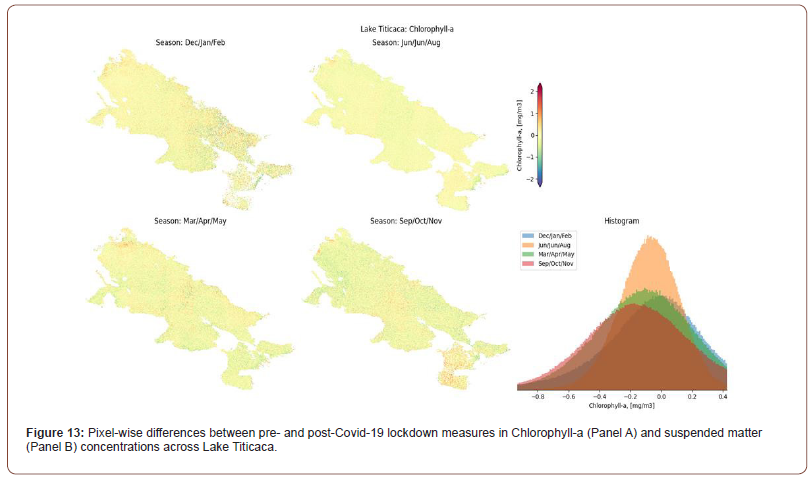
Table 2:Changes in WQ metrics at Virtual Gage locations in Lake Titicaca.

In addition to corresponding with the Virtual Gage locations, these areas tend to be isolated from the main lake area and in bays and inlets. Despite active lockdown measures in La Paz/El Alto during April-May 2020, no significant effects on WQ metrics were observed. However, there were significant differences found at the adjacent Virtual Gage locations (3 and 5) downstream of Achacachi and Desaguadero, respectively. A further analysis about local implications of the lock-down measures in terms of population movement and impacts on water and sanitation infrastructure utilization would help explain these differences. Table 2 summarizes the significant (p < 0.05) differences between pre and post Covid-19 lockdown measures, with the site-wide differences illustrated in maps of the entire water surface across the site (Figure 13).
Each 10m pixel depicts the difference in mean WQ metric values between the pre- and post-Covid-19 timeframes. Little to no significant changes were observed across the entire lake from March through August, then from September to November significant increases in suspended matter concentrations were observed near the areas that correspond with Virtual Gages 1, 2, and 4. Following this, there was a significant decrease in suspended matter near Virtual Gage locations 3 and 4 from December 2020 through February 2021.
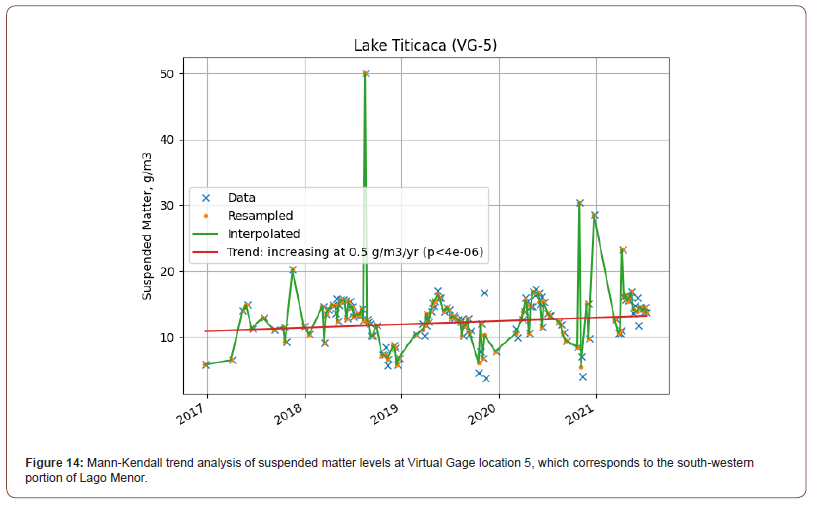
Interestingly, at Virtual Gage location 5, there was both an increase in pre- vs. post Covid-19 changes to suspended matter and turbidity during March-May 2020 and December-February 2020- 2021. This is also observed in the long-term trend found in the full time series data from the Mann-Kendall analysis (Figure 14) and further highlighted in the Trend Map surface (Figure 15).
Rio Reconquista basin
The Rio Reconquista Basin houses around 11% of Argentina’s population, comprising 33% of the Buenos Aires metropolitan area, and as a result faces considerable pollution from industrial wastewater and untreated sewage from informal residential settlements [10,11]. Regional programs have implemented measures to improve both wastewater and flood control infrastructure throughout the basin [12]. Importantly, this includes channelization of the Rio Reconquista through the densely populated area between Roggero Dam (Lago San Francisco) and the Rio Lujan. While such channelization helps control flows from the dam through the urban areas, it can also concentrate polluted runoff (Figure 16).
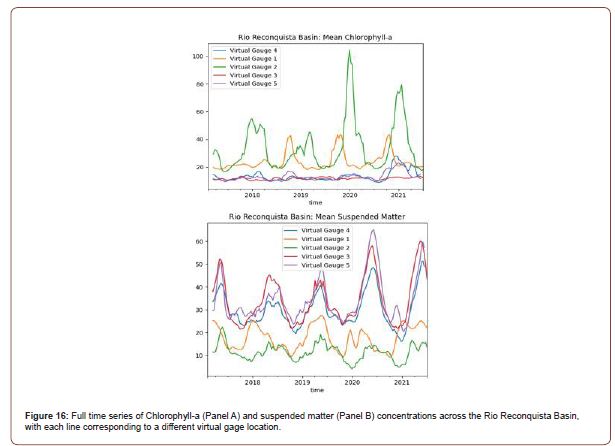
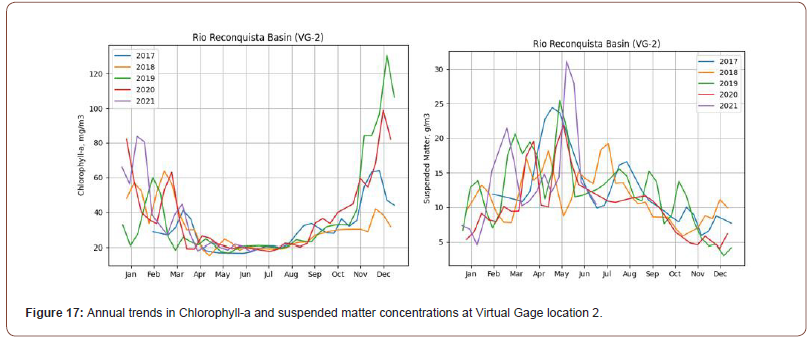
Interestingly, the conveyance of water through the Rio Reconquista can be observed in the lag between water leaving Lago San Francisco (Virtual Gage 1) and flowing through the confluence with the Rio Lujan (Virtual Gage 2). The overall higher concentrations of Chlorophyll-a at Virtual Gages 1 and 2 (Panel A) are due to the greater input of nutrients that trigger algae growth from the urbanized watershed, coupled with lower overall volume of water in this part of the system. The opposite effect is observed in suspended matter concentrations (Panel B), where the inherent presence of suspended sediments is higher at locations where water volume is greater and there are greater inputs from nonurbanized sources.
Strong seasonal trends in all WQ metrics are observed across the entire site and are particularly pronounced at the specific Virtual Gage locations (Figure 17). To effectively monitor the longterm and Covid-19 lockdown-related effects on WQ metrics across the entire region, the Virtual Gages were established at strategic points. Starting with those specific to the Rio Reconquista, Virtual Gages 1-3 were established at Lago San Francisco, the lower section of Rio Reconquista, and the outlet of the Rio Lujan, respectively. To characterize the adjoining basins in the Buenos Aires metropolitan region, Virtual Gages 4 and 5 were established at the outlet of the Matanzas River and downstream from the city of La Plata, respectively. All Virtual Gage locations were selected based on input from IDB stakeholders, being of a certain size (> 50m wide), and proximity to densely populated areas.
Higher levels of Chlorophyll-a (Panel A) from November to March appear to correspond with higher Austral summer temperatures. While higher suspended matter concentrations (Panel B) are observed into the wetter months of February to April.
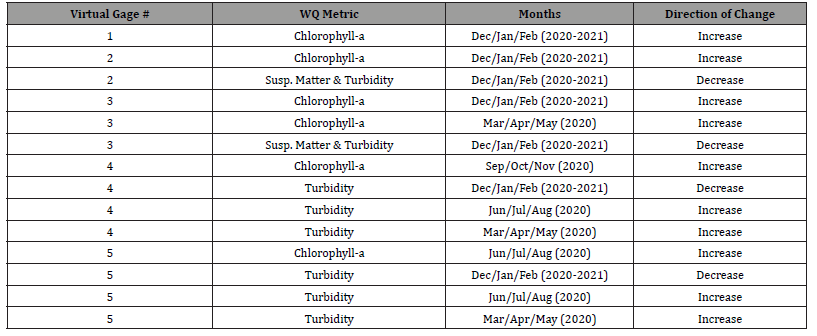
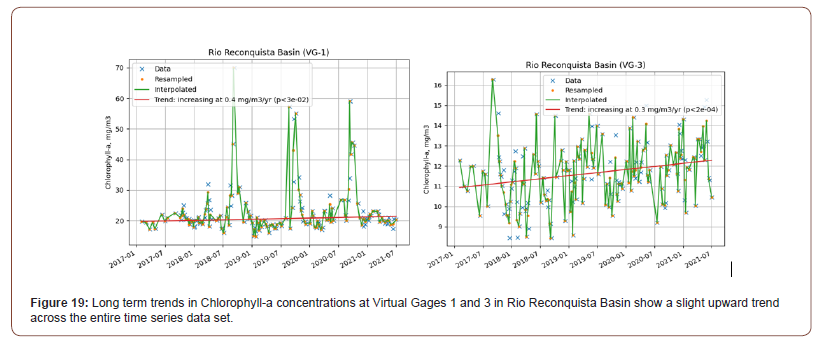
There were significant differences found in WQ metrics observed from Covid-19 lockdown measures at several Virtual Gage locations in the Reconquista River Basin (Table 3). Primary lockdown measures in the Buenos Aires region took place between March-July 2020. Of note are the increased Chlorophyll-a concentrations at Virtual Gages 1, 2, and 3 during Dec/Jan/Feb 2020-2021 of post Covid-19 lockdown. These differences are also observed in maps illustrating the simple difference in mean values between pre- and post-Covid-19 around the Virtual Gage locations (Figure 18). While this could point to greater residential wastewater production during lockdown measures, there has also been increasing Chlorophyll-a concentrations at Virtual Gage locations 1 and 3 since 2016 (Figure 19).
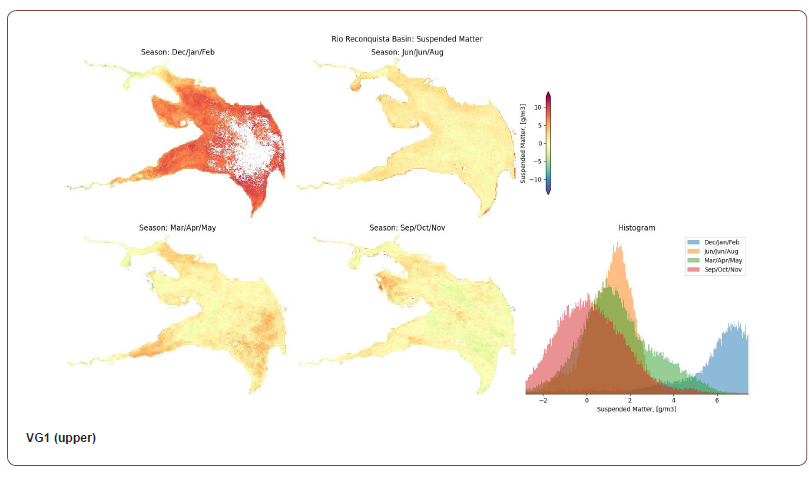
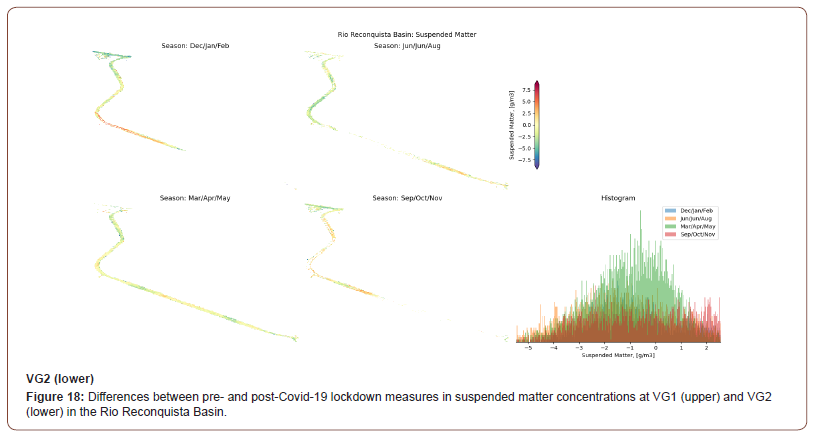
Table 3:Changes in WQ metrics at Virtual Gage locations in the Reconquista River Basin.
Each 10m pixel depicts the difference in mean WQ metric values between the pre- and post-Covid-19 timeframes. VG1 shows slight increases in suspended matter concentrations in parts of the reservoir from March until November, then a more substantial increase into December and the early parts of 2021. VG2 shows decreased suspended matter concentrations at a few locations during March/April/May and June/July/August 2020. Of note is the decrease during March/April/May 2020 towards the upstream end of VG2, where the Parque Industrial Tigre is located. In June/July/ August 2020, when regional lockdown restrictions begin to ease, the suspended matter concentrations begin to increase in this same area.
These upward trends could be in part due to increased runoff of organic compounds from agricultural practices occurring throughout the watershed, which would provide fuel for algae growth.
Ypacarai lake
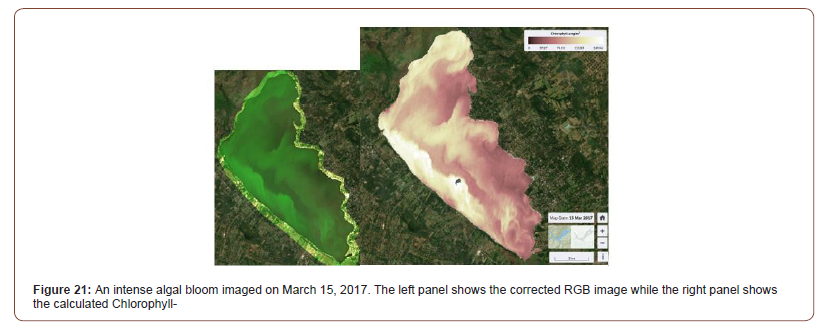
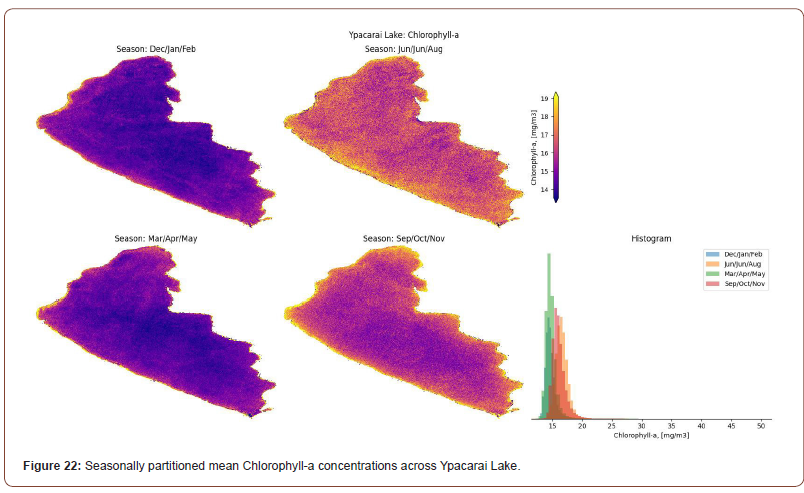
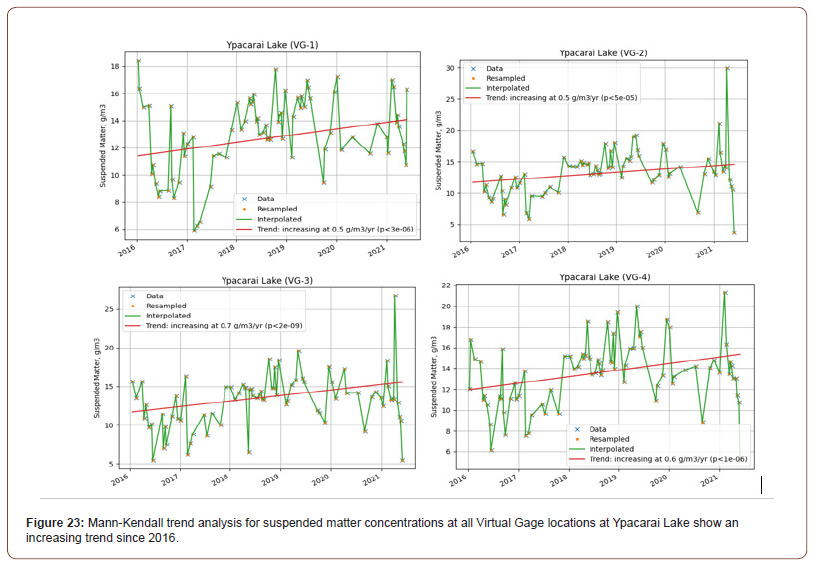
Located ~30 km east of Paraguay’s capital city Asuncion, Ypacarai Lake is a major source of drinking and irrigation water for the region as well as serving as a popular tourist attraction. With a relatively large surface area (60 km²), average depth of 1.72 m, and location in a subtropical climate, the lake has long suffered from eutrophication and intense algal blooms [13]. Additionally, a steadily increasing population with limited access to a formal sewer network results in high organic nutrient loads flowing into the lake. While the wetland areas at the north (Yukyry Creek) and south Pirayu Creek) can filter some of this load, relatively low flow rates from the only outflow point (Salado River) further contribute to algal blooms [14]. Consistently high Chlorophyll-a concentrations are observed across the entire lake (Figure 20) throughout the entire time series, with notably high values during an algal bloom in March of 2017 (Figure 21). There is a slight seasonal variation in Chlorophyll-a concentrations with higher values from June through August (Figure 22), and over the entire time series there is no statistically significant upward trend or downward trend. Separately, there are significantly increasing trends in suspended matter and turbidity values at all four Virtual Gaging locations across the lake throughout the entire time series (Figure 23,24).
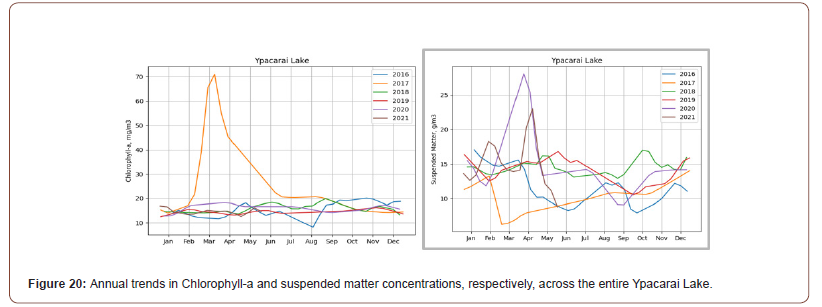
Consistent levels of Chlorophyll-a concentrations appear to correspond to the lake’s subtropical location, shallow depth, and low turnover rate. A significant spike in Chlorophyll-a concentration shows an inverse relationship with suspended matter during an algal bloom in early-to-mid March 2017. This supports the idea that clear water conditions can predicate intense algae growth and subsequent bloom events.
While the average value across the entire reservoir is ~70 mg/ m³, some locations approached 150 mg/m³. This is a significant deviation from the normal values, which range from 10-20 mg/m³ between 2016 until present. Importantly, this bloom event occurred when lower than normal suspended matter concentrations were observed across the entire reservoir. This demonstrates an inverse relationship between Chlorophyll-a and suspended matter concentrations and supports the idea that more clear water allows for increased algae production.
Each surface depicts the mean pixel value across the entire site throughout a three-month period. While there is some localized spatial variation, the small size of this site leads to rather consistent values across the entire area.
These increasing trends in suspended matter occur while there are no or decreasing trends in Chlorophyll-a concentrations at the same Virtual Gage locations. Despite the anomalous algal bloom, this could point to how higher overall suspended matter concentrations mitigate algae growth across the entire water body.
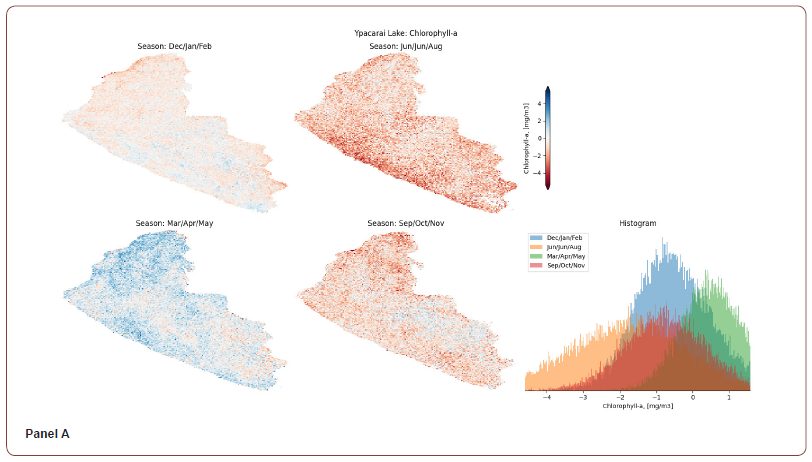
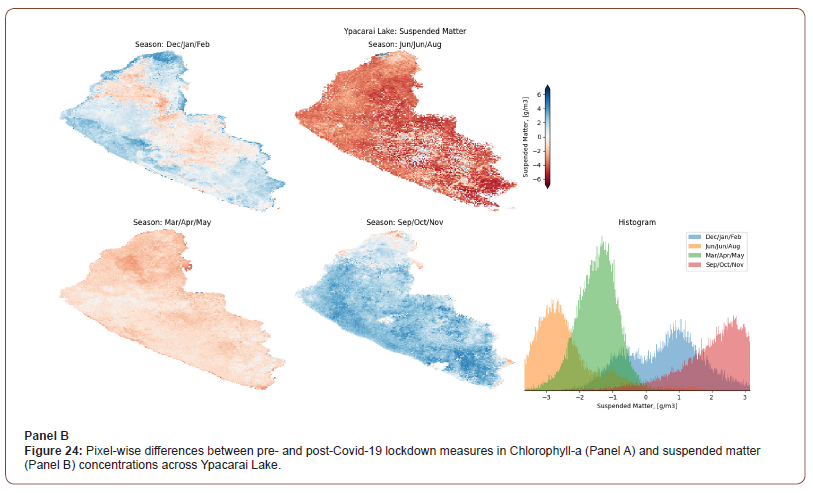
There were no significant differences found between WQ metrics pre- and post-Covid-19 lockdown measures at any Virtual Gage location on Ypacarai Lake. However, maps illustrating the pixel-wise mean difference between pre- and post-Covid-19 across the entire water surface show observable differences based on season (Figure 23). From March-May of 2020, there is a relatively neutral change signal in Chlorophyll-a, while for suspended matter there is an overall decreasing trend. This decreasing trend continues for suspended matter concentrations into June/July/August 2020 before heading in the opposite direction from September 2020 through February 2021. This change in signal could be attributed to limited human activity during the initial lockdown restrictions, then increased travel to the region as people began to work remotely and vacation in the region.
Each 10m pixel depicts the difference in mean WQ metric values between the pre- and post-Covid-19 timeframes. Negative pixel values are areas where there was a significant reduction in a WQ metric when comparing pre- vs. post-Covid-19 lockdown restrictions. Panel B shows that when comparing the months of June/July/August, suspended matter concentrations decreased significantly across the entire water body. This trend then reversed course and increased into the months of September/ October/November before becoming more mixed into the months of December/January/February 2020-2021. While these maps likely reflect some of the regular seasonal signal, the significant differences between pre- and post-lockdown conditions should be further investigated.
Summary
Applicability to other water bodies
Remote Sensing applied to monitoring of water quality in lakes, rivers and reservoirs is a valuable emerging technology that can provide geospatial information about water clarity, nutrient, bacterial and industrial pollution from urban and rural sources. The methodology presented in this paper using cloud computing allows rapid monitoring deployment and scalable coverage across numerous watersheds and geographies.
This significantly lowers the costs of obtaining water quality information compared to laborious water sampling and collection methods. Furthermore, satellite data acquisition and processing are automated and available continuously across the globe, and new data are automatically analyzed and contextualized within seasonal or historical trends. This allows investments in water and sanitation infrastructure to be valued based on realized regional and community benefits and allows operators of water systems to reduce risks and lower operational and management costs.
This study used remote sensing to determine if changes in human activity due to the Covid-19 lockdown measures of 2020- 2021 could be detected in resulting water quality indicators across four water bodies in Latin America. The hypothesis is that changes in industrial, commercial, and residential occupancy would be reflected in key water quality metrics measured across the pilot sites.
To locate and measure these changes, we conducted a series of one-way ANOVA (analysis of variance) statistical tests comparing the full historical archive of remote sensing data before and after the onset of Covid-19 lockdown measures across a range of locations. We also produced spatial maps that highlight locations within each site where noted differences are observed following the implementation of Covid-19 lockdown conditions.
Although this paper presents a comprehensive analysis of this entirely new source of water quality data across the sites and locations of interest, a more detailed analysis can be performed by looking at different timeframes (e.g., entire data set or monthly aggregates) within these watersheds.
Additional insights may be unraveled by further combining the water quality data sets of this work with other sources of information including local sensors, information from water and sanitation utilities and a more detailed analysis of the timing of location conditions and their local impacts.
Covid-19 findings
Results of this study show that remote sensing can be used to detect minor and more significant changes in the clarity of water (turbidity), sediment transport (total suspended matter), and algae (Chlorophyll-a) concentrations at specific locations during the period coinciding with the Covid-19 lockdown. The timing and duration of lockdown measures vary based on location; Buenos Aires, Argentina from early March to late July 2020, Asuncion, Paraguay from early March to late May 2020, La Paz/El Alto, Bolivia from early April to late May, and Rio de Janeiro, Brazil during May 2020. Location-specific timelines are provided in Appendix C. In many locations these changes were statistically significant, relative to baseline years prior to 2019. Additionally, the difference maps showed where the most pronounced changes occurred across each of the sites and some of the areas were significant in extent. It is important to note that across all four sites in this pilot, there are no consistent trends in magnitude, spatial extent, or direction of changes. This is likely explained by the diversity of the four water systems in this pilot and complexity of local land-use, mix of runoff (urban & agricultural & intertidal), as well as the prevailing or seasonal hydrological and meteorological conditions.
The most significant changes that were observed, in relation to the Covid-19 restrictions, generally occur in areas directly adjoining or downstream from densely populated areas. For example, in Rio de Janeiro (Guanabara Bay), significant differences in water quality were observed at several locations corresponding to a timeframe generally coincident with Covid-19 lockdown measures. The most pronounced changes in water quality and lock-down measures occurred in the month of May 2020, as discussed further in the results section.
In Lake Titicaca, significant differences in WQ metrics coincident with Covid-19 lockdown measures have also been observed at several locations. Significant changes in post- Covid-19 water quality are temporarily observed in isolated areas downstream from the larger population centers in La Paz, Achacachi, Desaguadero, and Puno. During the same time, the offshore parts of the lake seem to follow normal seasonal trends during the Covid-19 period.
Primary lockdown measures in the Buenos Aires region between March and July 2020 appear to precede the increased Chlorophyll-a concentrations across several locations in the Reconquista River Basin during Dec 2020 & Jan/Feb 2021, which could be indicative to higher untreated or partially treated wastewater production during the lockdown period. It is also important to note that since 2016 -- the start of the Sentinel 2 archive -- there is an underlying trend of increasing eutrophication (as observed from increasing Chlorophyll-a concentrations) at specific locations selected in this study (Virtual Gages 1 and 3).
In Ypacarai Lake, Paraguay, there were no statistically significant changes observed in water quality parameters pre- and post-Covid-19 lockdown measures at any of the study locations. However, seasonal differences and long-term increasing trends for suspended sediments across all locations of interest in this pilot are quite notable. The increased sediments could be indicative of long-term increase in nutrient loading from agriculture, which could be driving further eutrophication of this lake. With limited urban development and a population of approximately 350,000 surrounding this waterbody, the impact of Covid-19 restrictions appears to be minimal.
Generally, the statistically significant changes described above, coinciding with the Covid-19 onset and in the vicinity of urban areas, are not generally observed farther downstream or off-shore, as the waters get mixed and diluted. This further indicates that the observed changes are likely caused by the implemented Covid-19 measures and human-induced changes in urban (residential and industrial) and rural (agricultural) demands on the water and sanitation systems. In order to isolate more localized changes, the remote sensing data generated from this pilot should be integrated with additional local contexts and datasets describing the extent, timing and type of impacts that were observed with regards to water and sanitation locally. Additionally, higher spatial and temporal resolution satellite datasets and local sampling data could be used to build on this local context to provide a highly local or personalized look into human-influence changes and trends in water quality at specific locations.
Next steps
There is significant growth in available low-earth orbit satellite imagery or aerial imagery platforms used for observation from private companies such as Planet Labs and public agencies such as NASA, ESA, and others. Significant improvements are expected in how often new images are generated. Daily revisits for larger > 5~10 km water areas are already possible. Satellite imagery from commercial platforms is available at 1-meter spatial resolution, enabling access to narrower rivers (>10~20-meter width) and smaller ponds and lakes. These can be easily integrated for specific applications where daily data or high-resolution products are needed. Additionally, autonomous optical sensors provide coverage for smaller streams, and important surfacewater locations continuously, enabling improved accuracy of data obtained from satellite imagery and continuous information when satellite imagery is not available. Continuous monitoring of smaller river, stream, canal and could particularly be helpful to pinpoint sanitation and waste-water treatment hotspots, which in turn could inform more localized spatial extents where to Covid-19 impacts could be more concentrated.
These results and remote sensing technology in general, can be a useful addition to the toolkit used by infrastructure, and water and sanitation teams in general or more specifically to understand the impacts due to Covid-19 restrictions. The new datasets generated through this pilot can help provide insight in three key areas:
Inputs on where to measure and optimal in situ sampling rates: Remote sensing results pinpoint locations of high activity and variability throughout the year, helping to optimize the effectiveness of on the ground sampling by ensuring sampling is happening in the most interesting places.
Where to plan and develop future remediation or investment efforts: These data can also be used to identify locations where problems are most frequently occurring, as well as understanding the mitigation or remediation measures that should be applied. In addition to location, the scale of the needed intervention can be determined based on modeled or predicted impacts, and then verified during project implementation.
Inputs to help understand the ecological impact of construction, civil engineering, or other infrastructure projects: This remote sensing dataset on water quality gives us insight on what seasonal fluctuations are to be expected, and how levels of different water quality parameters are shifting over the long term. By combining this dataset with the timing and location of engineering projects, or interventions, meteorological and specifically rainfall data, as well as land use change information more generally, we can reach a more complete understanding of the downstream water quality and other environmental impacts from various projects.
This analysis of the water quality data sets can be extended by integrating local in-situ water quality data, or additional data on meteorological and hydrodynamics, as well as quantified geospatial datasets describing specific changes resulting from Covid-19 socioeconomic restrictions across the locations, or other data sets as they become available. Local water-quality in situ data would allow validating and calibrating the satellite-based retrievals to get more quantitative results and the meteorological and hydrological data sets could provide additional context on the relationships between water quantity and quality. Additionally, geospatial information about wastewater infrastructure quality, waste outflow locations and changes in population movement during the lock-down could be used to identify locations for study further upstream within the urban system before significant mixing or dilution occurs. Other data indicating domestic water consumption or transportation data could also be used as proxies for the severity and duration of changes that were implemented in response to the Covid-19 pandemic and its multiple waves of infections. These additional datasets and analysis would allow these findings to be applied towards more quantitative and finer resolution scales in time and space. Finally, for further validation of the findings in this research, it may be useful to evaluate the post-pandemic time-period as normal population movement resumes and compare that time frame with a return to baseline conditions in water quality parameters. This would require taking a post-pandemic period of at least 12 months as a new baseline for comparison with data before and during the Covid-19 pandemic restrictions.
To read more about this article...Open access Journal of Hydrology & Meteorology
Please follow the URL to access more information about this article
To know more about our Journals...Iris Publishers
To know about Open Access Publishers


No comments:
Post a Comment