Authored by Boris Bauer*,
Abstract
The aim was to develop heated knitwear that increases heat power when the skin temperature drops and reduces heat power when the skin temperature rises, thus regulating the thermal insulation as required. The physiological term for the variability of human skin temperatures is vasomotor activity. Therefore, the term vasomotor- regulated function is used for heated knitwear that electronically regulate the heating power on the basis of skin temperature measurements. Vasomotor-regulated knitwear require the development of sensing, heat and control electronics and the integration of electronic components into knitted structures. The yarns and knitted structures developed achieve Technical Readiness Level 5 and are validated on a calorimeter that simulates human heat generation and emission.
Keywords:Sensor-yarns; Heat yarns; Contact yarns; Knitted structure; Knitwear, calorimetry; Vasomotoric; Thermal insulation; Heat; Sensor; Control electronics
Introduction
Heat exchange between people and the environment is in constant regulation. On one side of the balance is heat generation. People generate 100 to 200 W when lying, sitting or standing by metabolism mainly in the brain and organs. During heavier activity, skeletal muscle metabolism is added, and heat generation increases to 300, 400 or 500 W during light, moderate or hard work [1]. The generated heat is pumped with the blood through the body to the skin and there, on the other side of the balance, emits the heat, primarily in the form of heat radiation in the mid-infrared, so-called MIR radiation. In unclothed humans, heat emission by MIR radiation is proportional to skin area and to the temperature gradient between skin and environment and is about 10 W m-2 K-1 [2,3]. This has the following consequences:
• With an average skin area of about 2,0 m-2 [4], unclothed humans emit at 5 K temperature gradient with about 100 W as much heat as generated lying down, at 10 K temperature gradient they emit with 200 W as much heat as generated standing up, at 15 K temperature gradient they emit with 300 W as much heat as generated at light workload, and at 20 K temperature gradient they with 400 W as much heat as generated at workload.
• At a moderate air temperature of 20 °C, 5 K gradient corresponds to 25 °C skin temperature, 10 K gradient corresponds to 30 °C skin temperature, and 15 K gradient corresponds to 35 °C skin temperature. Finally, 20 K temperature gradient corresponds to 40 °C skin temperature at the physiological upper limit. The skin cannot get any warmer than this and therefore humans cannot emit more than about 400 W of heat in the form of MIR radiation. Therefore, for thermal equilibrium, convection and evaporation are additionally needed during high physical activity.
• 35 °C skin temperature is felt warm [5]. So, people who work lightly at 20 °C air temperature and generate 300 W of heat do not wear clothes, at least not for cold protection. On the other hand, 30 °C skin temperature is felt cool and if a person who generates only 200 W heat at 20 °C air temperature wants to have 35 °C skin temperature to feel more comfortable, he may not emit 10 W m-2 K-1 but only 6,7 W m-2 K-1. When lying down and generating 100 W of heat, he may even emit only 3,3 W m-2 K-1. So, people wear clothes for protection against the cold at low physical activity in cool climates.
Under constant conditions, heat generation and emission are in balance, and thus the skin temperature also remains constant. However, if the air temperature or physical activity is reduced, the skin temperature is also reduced. If a person puts on clothing, this has the following effect: now, the temperature gradient between the skin and clothing is effective for heat emission, and in cool or temperate climates this is lower than the temperature gradient between the skin and air temperature. Thus, when clothing is put on, the temperature gradient is reduced and with it the heat emission. In summary, the thermal insulating effect of clothing lies in the reduction of temperature gradients. The amount of thermal insulation can be varied by the number of layers of clothing. For an increase in thermal insulation, a person puts on another layer of clothing, and for a reduction, he takes it off again. Against this background, the thesis is formulated for the present project work that temperature gradient and heat emission can also be regulated via electrical heating power. Variable heated clothing is clothing with variable thermal insulation and ideally the clothing regulates heat emission itself by increasing the heating power when the skin temperature decreases and vice versa. The physiological term for the continuous regulation of skin temperature is vasomotor activity. Therefore, the term vasomotor-regulated function is used for the electronic regulation of heating power in clothing as a function of variable skin temperatures.
Vasomotor-regulated clothing requires sensor electronics for measuring skin temperatures, control electronics for calculating heat demand, power electronics for providing energy, and heat electronics for distributing heat in knitted clothing. Technologies are also needed for integrating the sensor and heat electronics into knitwear. Contacting technologies are also needed. These technologies have been developed in the Ulimpia project [6] and are presented now. A calorimeter simulating human heat generation and emission was also developed for the development and validation work.
Calorimeter Development
Our institute has been developing special calorimeters for investigations on thermodynamic processes and porous materials for many years [7-9]. The central element of the current calorimeter is a square aluminum plate with an edge length of 20 cm, an area of 0,04 m2 and a thickness of 6 mm, hereinafter referred to as the calorimeter plate and shown in the lower right-hand corner of Figure 1a. According to ISO 11092 [10], the calorimeter plate is surrounded by framing and base plate, which are heated isothermally to the calorimeter plate, causing the calorimeter plate to emit heat only upward. The framing is 7,5 cm wide and the entire calorimeter has a base area with 35 cm edge length (Figure 1b). The calorimeter is mounted on a 10 cm high aluminum frame in a climate-controlled laboratory room with an air temperature of 20,0 ± 2,0 °C and a relative humidity of 60 ± 5 %.
Installed on the underside are 2 heating mats on the calorimeter plate, 4 heating mats on the framing and 6 heating mats on the base plate (Figure 1a). Each heating mat has 15 W power and consequently the calorimeter plate, framing and base plate have a total heating power of 30, 60 and 90 W respectively. Three temperature sensors are integrated in the calorimeter plate, framing and base plate and connected to a control electronic via black cables. The 12 heating mats are connected to power electronics via white cables (Figure 1b). During measurement, the calorimeter plate and framing are covered with a red-colored TPU epidermis with a thickness of 0,32 ± 0,03 mm (Figure 1c). Either the temperature of the calorimeter plate between 25 and 70 °C or the heating power of the calorimeter plate between 0 and 30 W can be preset. In the case of temperature presetting, the control electronics regulate the heating power, and in the case of heating power presetting, thermal processes regulate the calorimeter temperature.

Calibration Measurements
In the following calibration experiment, the temperature of the calorimeter plate is preset. The experiment starts at 25 °C in thermal equilibrium, that means the calorimeter plate is isothermal to the framing and base plate and emits the heat supplied at the bottom by the heating mats exclusively upwards. Thermal equilibrium also means that heat supply and emission upwards have the same amount. Now the temperature presetting is increased by 3 Kelvin to 28 °C, with the following consequence: the control electronics increase the heating power, the thermal equilibrium is disturbed, the heat generation becomes greater than the heat emission, the temperature of the calorimeter plate increases, after one to two minutes the new temperature presetting of 28 °C is reached, the control electronics regulate the heating power back and after 15 to 20 minutes the new thermal equilibrium at 28 °C calorimeter temperature is reached. In the same way, the temperature of the calorimeter plate is successively increased to 31, 34, 37 and 40 °C. After 20 minutes in thermal equilibrium, the heating power is determined and entered in Figure 2. It can be seen that there is a clear linear correlation in thermal equilibrium between temperature and heating power of the calorimeter plate. Plotted on the x-axis in Figure 2 is the temperature of the calorimeter plate from 25 to 40 °C. On the y-axis, the heating power of the calorimeter plate is first plotted and it can be seen that 1,0 K temperature change is proportional to about 0,4 W heating power. The calorimeter plate measures one twenty-fifth of a square meter. Therefore, the heat emission normalized to the calorimeter plate is numerically a factor of 25 greater than the heating power, and 1,0 K temperature change is proportional to 10 W m-2 relative heat emission. The skin area of average-sized people measures 2,0 m2. Therefore, the absolute heat emission normalized to average humans is numerically a factor of 50 greater than the heating power and 1,0 K temperature change is proportional to 20 W absolute heat emission, and this is comparable to metabolic heat production at different activity.
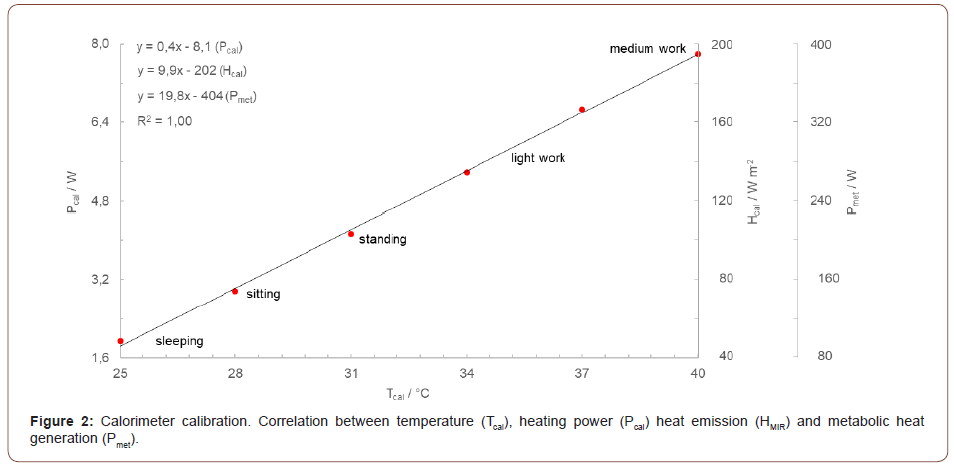
The air temperature in the laboratory room is a constant 20 °C during the calibration measurement. If you at each measuring point divide the heating power by temperature gradient and the area of the calorimeter plate, you obtain the heat emission of the calorimeter plate as a constant at 9,8 W m-2 K-1, which is almost identical to the heat emissivity of human skin. This means that the calorimeter plate has the same temperatures as human skin at comparable heat generation. People sleeping unclothed without a blanket at 20 °C air temperature have 25 °C skin temperature, freeze severely and will probably fall ill. People who are lightly clothed at 20 °C air temperature and sit or stand still for longer time periods have 30 °C skin temperature, feel chilly and possibly put on some clothes. People who work lightly at 20 °C air temperature have 35 °C skin temperature, feel warm and comfortable, and usually the skin does not get much warmer, because people who work moderately or hard at 20 °C air temperature start to sweat and keep skin temperatures constant by evaporation. Body movement also makes convection effective.
The calorimeter plate thus simulates heat generation and emission of humans and the great advantage is that heat generation and emission of the calorimeter plate are completely controllable. When a textile is placed on the calorimeter plate, the heat emission is reduced in the same way as when a human put on corresponding clothing, and this heat emission reduction can be precisely quantified. For measurements under temperature preset, the control electronics regulate the heating power back. For measurements under pre-set heating power, the temperature of the calorimeter plate increases. The thermal insulation of the textile can be calculated equally from heating power reduction and temperature increase. This makes the calorimeter ideal for the development of vasomotor-regulated knitwear.
Sensor Yarn Integration
Sensor yarns are being developed for measuring skin temperatures with vasomotor- regulated knitwear. Polyester filaments are covered with copper or stainless-steel wires for this purpose. Examples shown in cross-section in Figure 3 are sensor yarn Y73, which is covered with one stainless-steel wire, and sensor yarn Y98, which is covered with two stainless-steel wires. The sensor yarns are knitted together with polyester filament yarn on an E18 flat knitting machine in such a way that continuous sensor yarn areas are formed. Figure 3 shows an example of the purl side of knitted structure T98 in top view. On the purl side, the sensor yarn lies on the surface of the knitted structure, and if the knitted structure were worn as clothing on the skin, and if the purl side were facing the skin, the sensor yarn would have direct skin contact. In contrast, with the plain side facing the skin, the sensor yarn would not have direct skin contact. In knitted structure T98, 7,6 m of sensor yarn form a smaller sensor yarn area and 15 m of sensor yarn form a larger sensor yarn area. Plugs are soldered to the ends of the yarn.

Experiment 1 investigates whether skin temperatures can be measured using knitted structures with integrated sensor yarns. To do this, various knitted structures are placed on the calorimeter plate and the sensor yarns are connected to an ohmmeter via the soldered plugs. The temperature of the calorimeter plate is increased from 25 to 40 °C in 3 Kelvin steps. Like human skin, the calorimeter plate thereby increases the heat emission from 50 to 200 W m-2 and this increases the temperature of the knitted structures and the electrical resistance of the integrated sensor yarns. In the four graphs in Figure 4, the temperature of the calorimeter plate is respectively plotted on the x-axis and the electrical resistance of the sensor yarn is plotted on the y-axis, and it can be seen that calorimeter temperature and electrical resistance of the sensor yarns are proportional. This proves that skin temperatures can be measured with knitted structures and integrated sensor yarns. In the chosen plot, the y-axis intercept marks the sensor yarn resistance in the unity Ω at a calorimeter temperature of 0 °C, and the correlation- line slope marks the temperature coefficient in unity K-1. The measurements in experiment 1 lead to the following results:
• Copper has significantly lower resistances than stainless-steel, and in this respect, sensor yarns covered with copper wires have significantly lower electrical resistances than sensor yarns covered with stainless-steel wires. When all the sensor yarns developed in the project are taken, the sensor yarns covered with copper wires have electrical resistances between 7 and 34 Ω m-1 and the sensor yarns covered with stainlesssteel wires have electrical resistances between about 600 and 2900 Ω m-1.
• In Figure 3, the two sensor yarns covered with stainlesssteel wires with the highest and lowest electrical resistance are shown from the test program. The stainless steel itself is identical in both yarns, but sensor yarn Y73 with one stainless steel wire of about 10 μm thickness has a much higher electrical resistance of about 2900 Ω m-1 than sensor yarn Y98, that has two stainless- steel wires of about 50 μm thickness and an electrical resistance of only about 600 Ω m-1. The tests show that the electrical resistance of the sensor yarns is inversely proportional to the number and diameter of the covered metal wires.
• Figure 4a shows a knitted structure with a commercially available PT100 sensor as a reference. At a temperature of 0 °C, this sensor has an electrical resistance of 100 Ω and a temperature coefficient of 0,35 K-1.
• Figure 4b and (b) show measurements on the small sensor yarn area of knitted structure T98, where sensor yarn Y98 is knitted in a length of 7,6 m. In the measurement in Figure 4b, the purl side of the knitted structure faces the calorimeter plate and is in direct contact with the calorimeter plate. In Figure 4c, the plain side of the knitted structure faces the calorimeter plate and the sensor yarn has no direct contact with the calorimeter plate. Nevertheless, the electrical resistance is almost identical in both measurements. In summary, the y-axis intercept is 4528 ± 1 Ω and the temperature coefficient is 1,72 ± 0,05 K-1. This is an important result with respect to the project goal, as it shows that skin temperature measurement with knitted clothing is also possible when the sensor yarns have no skin contact.
• As shown, Figure 4b and c show measurements on the small sensor yarn area of knitted structure T98 with 7,6 m sensor yarn Y98. Figure 4d shows measurements on the large sensor yarn area of knitted structure T98 with 15 m sensor yarn Y98. Finally, Figure 8 shows measurements on the knitted structure TSH1. There, sensor yarn Y98 is knitted in a length of 22 m. It can be seen that electrical resistance is proportional to the sensor yarn length with values between about 4500 and 13000 Ω and temperature coefficient with values between about 1,7 and 4,1 K-1.

Heat and Contact Yarn Integration
For the heat function of the vasomotor-regulated knitwear, heating yarns are developed from 34 silver-coated PA filaments with an electrical resistance of 424 Ω m-1 and additionally, contact yarns are also developed from 72 silver-coated PA filaments with an electrical resistance of 68 Ω m-1. The heat and contact yarns are knitted together with wool-containing staple fiber yarn on an E12 flat knitting machine to form the knitted structures TH1 and TH2. The heat yarns form continuous heat yarn areas in the center of the knitting structures. The heat yarn length is the same, but in knitted structure TH1 the heat yarn is more densely knitted and therefore the heat yarn area in knitting structure TH1 covers only about a quarter of the calorimeter plate. In contrast, the heat yarn area in knitted structure TH2 covers three quarters of the calorimeter plate. The heat yarn areas are confined on two opposite sides by areas of contact yarn. Pushbuttons are mounted in these contact yarn surfaces, via which a power supply unit is connected. In Figure 5, green dashed lines indicate the calorimeter plate. The pushbuttons mounted in the contact yarn surfaces can also be seen.
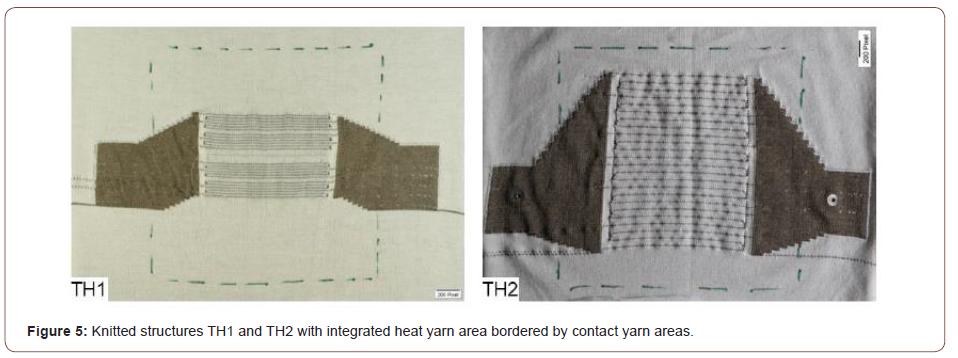
In experiment 2, the thesis is tested whether the heat emission of knitwear can be regulated via electrical heating power. For this purpose, the calorimeter plate is preset and heated to a temperature of 30 °C. The gradient to the 20 °C air temperature in the laboratory is thus 10 K. First, knitted structure TH1 is applied. The heat yarn area is connected to a power supply unit via the push buttons mounted in the contact yarn areas, and a potentiometer is used to manually vary the electrical voltage between 0,0 and 7,0 V, as shown in Figure 6a on the y-axis. As a consequence, the electrical current varies between 0,0 and 0,6 A, as shown in Figure 6a on the x-axis. Multiplying voltage and amperage gives the electrical heating power, which varies between 0,0 and 4,0 W. In Figure 6b, the heating power of the knitted structure is plotted on the x-axis and the heating power of the calorimeter plate is plotted on the y-axis and it can be seen that the heating power of the calorimeter plate is inversely proportional to the heating power of the knitted structure TH1. Now the experiment is repeated in an identical way with knitted structure TH2 and plotted in Figure 6c are corresponding electric voltage and current and in Figure 6d corresponding heating powers. Although in knitted structure TH1 the heat yarn area covers only about one quarter of the calorimeter plate and in knitted structure TH2 about three quarters, the results are almost identical. The different size of the heat yarn areas apparently has little effect on the heat emission of the two knitted structures, either unheated or heated. Experiment 2 can be summarized as follows:
• Figure 2 shows that about 4,0 W of heating power are required to heat the calorimeter plate to a temperature of 30 °C, that is 10 K warmer than the air temperature. The heat emission normalized to the calorimeter plate is 100 W m-2 and the absolute heat emission normalized to average humans is 200 W, which is about the same heat as human generated while sitting or standing. 30 °C skin temperature is felt cool and many people put some clothes on.
• When the unheated knitted structures TH1 or TH2 are applied, the heating power of the calorimeter plate is reduced from 4,0 to 2,5 ± 0,1 W. This is shown by the y-axis intercept in Figure 6b and d. In terms of heating power, the thermal insulation of the two knitted structures is thus about 1,5 W. This corresponds to 38 W m-2 heat emission of the calorimeter plate or 75 W heat emission of average humans.
• If people put on knitwear corresponding to the knitted structures TH1 and TH2, the heat emission is reduced to about 125 W. This is ideal for sitting quietly at 20 °C air temperature. But if the air temperature reduces to 15 or 10 °C, the heat emission would increase to about 190 or 250 W and become increasingly chilly.
• Increasing the heating power of the knitted structures TH1 or TH2 by 1,0 Watt reduces the heating power of the calorimeter plate by 0.62 ± 0.2 W. This is shown by the correlation-line slope in Figure 6b and d and corresponds to a heat emission of 15 W m-2 that is normalized to the calorimeter plate or 30 W heat emission that is normalized to average people.
• People wearing knitwear corresponding to the knitted structures TH1 and TH2 can therefore sit comfortably at 15 °C air temperature with 2,0 W heating power and even at 10 °C with 4,0 W heating power.
• Figure 2 shows that 1,0 K temperature change at the calorimeter plate is proportional to about 20 W human’s heat emission. Thus, with each watt of heating power, knitwear corresponding to the knitted structures TH1 and TH2 increases the skin temperature by 1.5 K.

Sensor and Heat Yarn Integration
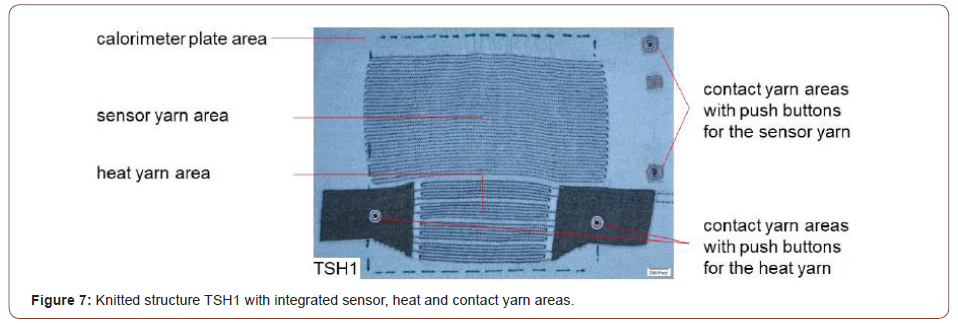
Experiment 1 uses knitted structure T98 to show that skin temperatures can be measured with integrated sensor yarns, and experiment 2 uses knitted structures TH1 and TH2 to show that heat emissions can be variably regulated with integrated heat yarns. Now, knitted structure TSH1 is used to investigate whether skin temperature measurement and heating are possible at the same time. The knitted structure TSH1 shown in Figure 7 consists of the same wool-containing staple fiber yarn as the knitted structures TH1 and TH2 shown in Figure 5 and integrated into the knitted structure TSH1 are the same heat and contact yarn areas as in knitted structure TH1. In addition, the Y98 sensor yarn shown in cross-section in Figure 3 is integrated in knitted structure TSH1 in a length of 22 m. The contact, heat and sensor yarn areas together cover almost the entire calorimeter plate, which is again indicated by the green dashed line in Figure 7.
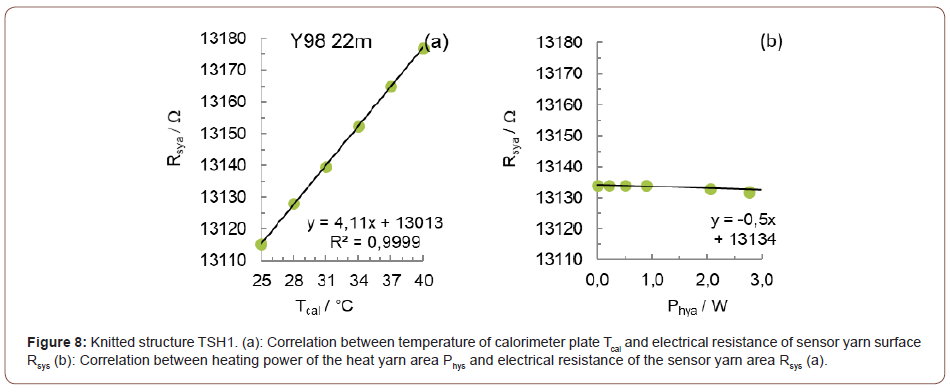
First, experiment 1 shown in Figure 4 is repeated with knitted structure TSH1 and the calorimeter plate is increased from 25 to 40 °C in 3 Kelvin steps. Figure 8a shows that this increases the electrical resistance of sensor yarn Y98 from about 13115 to 13180 Ω. The temperature coefficient, which is proportional to the sensor yarn length, is 4,11 K-1 in knitted structure TSH1.
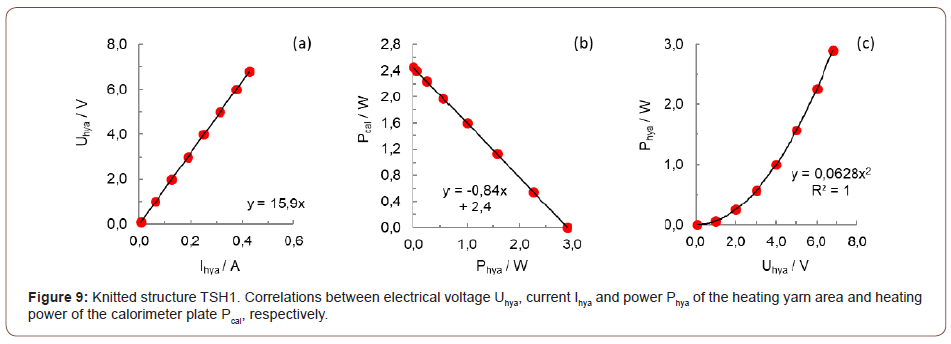
Then experiment 2 shown in Figure 6 is repeated and the calorimeter plate is heated to 30 °C or respectively 10 K above air temperature. Again, the heating power of the calorimeter plate is reduced from 4,0 W to 2,5 W when knitted structure TSH1 is placed unheated. Again, electrical voltage and current are varied with a power supply, and although the heat yarn area becomes 1,5 K warmer for every 1,0 W of heating power, the electrical resistance in the sensor yarn shown in Figure 8b remains constant at about 13135 Ω. In summary, Figure 8a shows that when the skin temperature changes, the electrical resistance of the sensor yarn area also changes, and Figure 8b shows that when the heating yarn temperature changes, the electrical resistance of the sensor yarn area stay constant. Thus, knitting structure TSH1 can simultaneously measure skin temperatures and regulate heat emission variably, and this is the principle of vasomotor-regulated knitwear. This requires a controller that converts electrical resistance of sensor yarns into skin temperatures based on the correlation shown in Figure 8a and converts skin temperatures into an electrical voltage in the heat yarn based on the correlations shown in Figure 9. An important parameter for this is electrical resistance of contact and heat yarn areas, which is shown in Figure 6a and c and Figure 9a as a correlation-line slope and varies between about 13 and 16 Ω for the knitted structures TH1, TH2 and TSH1.
Discussion
The concept of Technology Readiness Level (TRL) is a method to estimate the maturity of innovative technologies [11]. In German or European research proposals, it is often required to define the starting and target points of the planned development in terms of TRL. The developments presented in this paper can be characterized according to the TRL concept as follows: In TRL1, the basic principle is defined as regulating the heat emission of clothing not by dressing or undressing clothing layers, but by increasing and decreasing electrical heating power. In TRL2, knitwear that electronically regulates heating power on basis of skin temperature measurements is defined as a potential application, which is referred to as vasomotor-regulated function. In TRL3, the concept of vasomotor-regulated knitwear is experimentally demonstrated by developing sensor, heat, and contact yarns and integrating them into knitted structures. In TRL4, a calorimeter is developed as an experimental setup in the laboratory to simulate human heat generation and emission, and in TRL5, the functional principle of vasomotor-regulated knitwear is demonstrated in validation measurements by using a knitted structure to simultaneously measure skin temperatures and regulate heat emission via heating power.
For further development to TRL9 and a marketable product, controller and knitwear must be developed and coordinated in parallel. This requires an interdisciplinary team of electronics engineers to develop or improve wearable heat and control devices, physiologists to develop the control algorithms, yarn manufacturers to develop sensor and heat yarns, and finally knitwear engineers to develop integration techniques. We hope to attract, and network interested parties with this publication. The calorimeter presented can provide valuable assistance in the development work.
To read more about this article....Open access Journal of Textile Science & Fashion Technology
Please follow the URL to access more information about this article
To know more about our Journals...Iris Publishers


No comments:
Post a Comment