Authored by Hesham Salem*,
Abstract
Simple, sensitive and reliable spectro-chemometric, Chemometric and thin layer chromatography (TLC)-densitometric methods were developed for simultaneous determination of binary mixture of timolol (TIM) and travoprost (TRA) without prior separation in their bulk drugs and dosage forms. The speectro-chemometric methods used are derivative spectrophotometry and isosbestic point methods. Multivariate methods involves the application of three chemometric techniques; classical least square (CLS) principal component regression (PCR) and partial least-squares regression (PLS) and thin-layer chromatography (TLC)-densitometric methods were developed for the simultaneous determination of TIM and TRA in presence of each other in bulk powder or in dosage form. Separation was carried out on merck HPTLC aluminium sheets of silica gel 60 F254 using ethyl acetate-methanol-ammonia (5:3:0.5) as mobile phase. All variables influencing the spectrophotometric and HPTLC methods were carefully investigated and optimized. The developed methods were evaluated according international conference of harmonization (ICH) rules. The current methods were successfully implemented for direct the determination of these drugs in their trade pharmaceutical formulations. The obtained results were contrasted with those calculated after application of reference method. The data obtained from both methods were statistically analyzed by Fand t-tests. The results of such study showed excellent agreement in respect to the accuracy and precision of the suggested and reference methods.
Keywords:Derivative spectrophotometry; Isosbestic point spectrophotometry; Multivariate chemometry
Introduction
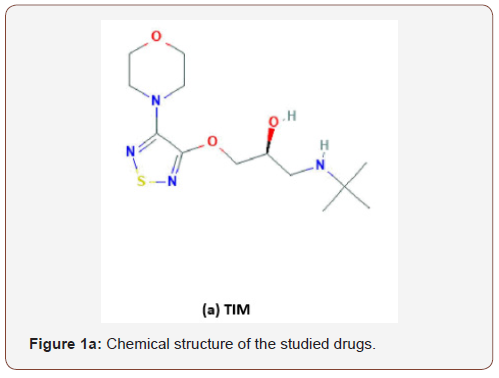
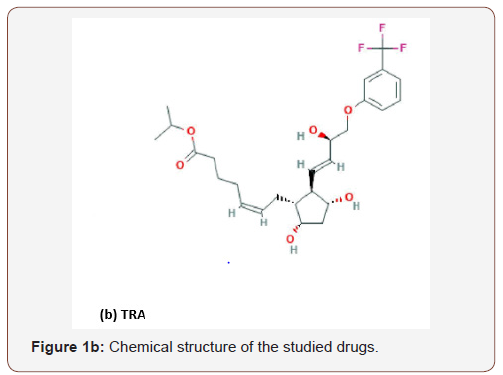
Timolol (TIM) (Figure 1a) is (S)-1-(tert-butylamino)-3-[(4- morpholin-4-yl-1,2,5-thiadiazole-3-yl) oxy] propan-2-ol. Timolol maleate is nonselective β-adrenergic receptors in the heart and decreases renin activity, all of which may play a role in reducing systolic and diastolic blood pressure. TIM is indicated for treatment of mild to moderate hypertension, reduction of mortality after myocardial infarction and migraine prophylaxis [1]. Travoprost (TRA) (Figure 1b) is chemically [1R-[1ᾳ(Z),2β(1E,3R),3ᾳ,5ᾳ]]- 7-[3,5-Dihydroxy-2-[3-hydroxy-4[3-(trifluoromethyl) phenoxy]- 1-butenyl]cyclopentyl]-5-heptenoic acid-1-methyl-ethyleste. Travoprost is used in the treatment of glaucoma [1]. Both drugs are still used as a binary mixture in some pharmaceutical preparations for treatment of reduction of elevated intraocular pressure with open-angle glaucoma. Several analytical procedures are available for the analysis of the cited drugs in their bulk forms, multi-component mixtures, dosage forms or biological mixtures. These procedures are UV-Vis spectrophotometric [1-8], HPLC [9-18], HPTLC [19- 21] and Chemometric [22,23] assay methods are reported in the literature for the estimation of TIM and TRA individually and in combination with other dugs. For the time being only few reports were found on the direct determination of binary mixture of TIM and TRA through HPLC and direct UV methods [1,15-18]. For this reason, this study describes for the first time the simultaneous determination of TIM and TRA by spectro-chemometric such as first derivative (1D) and isosbestic point methods, multivariate methods involves the application of three chemometric techniques; classical least square (CLS) principal component regression (PCR) and partial least-squares regression (PLS) as well as thin-layer chromatography (TLC)–densitometric method, for simultaneous determination of the current drugs without prior separation in their authentic powder and available dosage form (Figure 1a & 1b).
Experimental
Apparatus
Shimadzu-UV 1800 double beam UV-Visible spectrophotometer (Japan) with matched 1 cm quartz cells at 200-400 nm range was used for all absorbance measurements. Spectra were automatically obtained by Shimadzu UV-Probe 2.32 system software. The data points for the zeroorder spectra were then collected at every 0.1 nm. All computations were performed in Matlab for WindowsTM version 6.5. The PLS procedure was taken from PLS-Toolbox 2.0 for use with Matlab® 7.9. TLC-spectrodensitometric system: CAMAG TLC scanner 3 S/ N 130319 operated with winCATS software, Linomat 5 autosampler (CAMAG, Muttenz, Switzerland), CAMAG micro syringe (100 μL). TLC aluminum sheets (20x20 cm) precoated with silica gel 60 F254 (Merck KgaA, Darmstad, Germany) were used. Calculations were performed using the Microsoft Excel program. The centrifugation system: Laboratory Centrifuge, Sigma 2-16KL, Sigma 2-16KHL, with order number 10350, 10353.
Materials and reagents
Pharmaceuticals: The investigated drugs were obtained and were used as such without further treatments : TIM (E.I.P.I.CO., Cairo, Egypt), TRA (Novartus Co., Egypt) with general estimated purity 99.44% w/w and 99.18% w/w on dried basis for TIM and TRA [1], respectively.
Solvents and reagents: Methanol (S.D. Fine-Chem Limite, India) was of analytical grade. Ethyl acetate and ammonia 30% (El- Nasr Pharmaceutical Co., Abu Zaabal, Egypt). In addition, Whatman No. 1 filter paper 110 mm diameter (Sigma-Aldrich) was used for filtration of sample solutions.
Pharmaceutical formulations: The pharmaceutical preparation; Avatan-T® eye drops labeled to contain 40 μg and 5 mg TRA and TIM per mL., respectively, manufactured by (Alcon, Co., Belgium).
Methodology
Standard preparations: Standard stock solutions containing 0.5 mg.mL-1 of either TRA or TIM were prepared separately by dissolving the reference materials in methanol. Regarding the stability of solutions of drugs, stock solutions were stored at room temperature and were found to be stable for at least 10 days.
Working preparations: Preparation of working solutions was done by diluting the standard solutions with methanol to give concentrations in the range 0.4-50 μg.mL-1 for either TRA or TIM.
Synthetic mixtures: Accurate volumes of standard solutions of TRA and TIM were transferred into two sets each of three 10-mL volumetric flasks then completed to volume with methanol so that the final concentration of each drug was within its linearity range as cited in Table 1.
Sample preparation • Eye drops sample: Dilute an appropriate volume of the solution in a volumetric flask so as to contain 40 μg and 5 mg TRA and TIM, respectively. Proceed as directed under 4.3.1. and 4.3.2.
General procedure
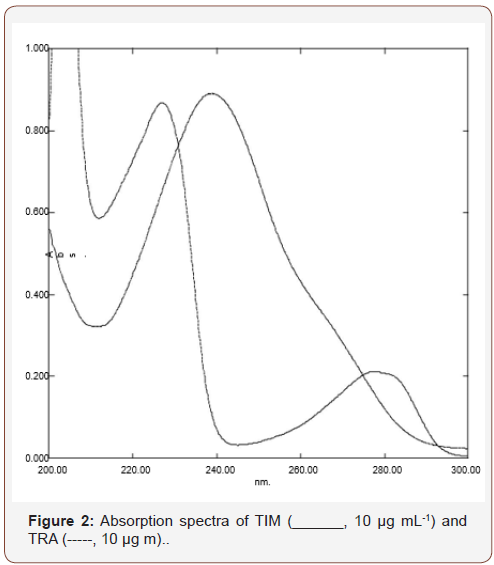
Spectro-chemometric methods: Different working standard solutions were prepared with known concentrations within the calibration range specified for each drug as shown in Table 1. These ranges were confirmed to obey Beer’s law for each of the cited drugs in methanol. These concentrations were used to construct calibration matrix which can be used for the direct determination of the current drugs by the different used techniques; (First derivative spectrophotometric (1D) and isosbestic point methods. The obtained absorption data in the general range of 200-350 nm (digitalized every 1.0 nm), against reagent blank treated similarly Figure 2, were stored in PC apparatus program. The spectral data were transferred to Microsoft excel 2003 program by performing statistical manipulation and processing them with the Standard curve fit package and matrix calculations and then were subjected to statistical treatment specified for each technique (Table 1) (Figure 2).
Table 1: Analytical parameters of the proposed methods
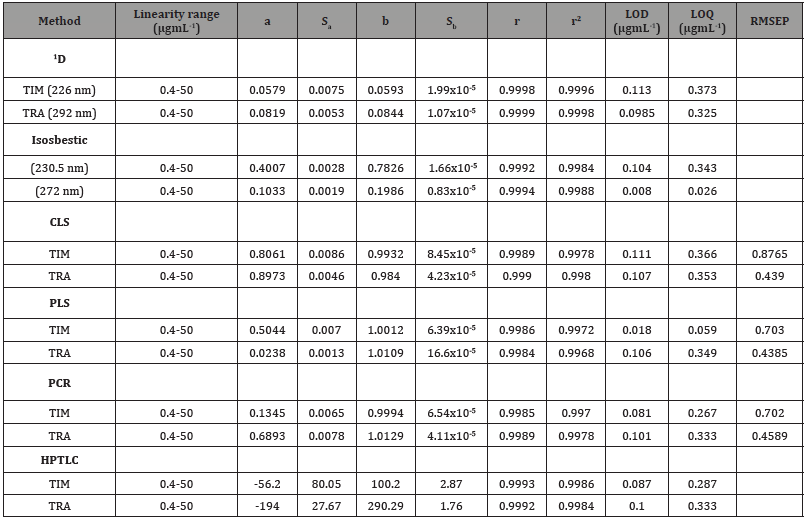
a-Intercept, Sa-SD of intercept, r-correlation coefficient, r2-Determination coefficient.
b-Slope, Sb-SD of slope, LOD-Lower limit of detection, LOQ-Lower limit of quantitation
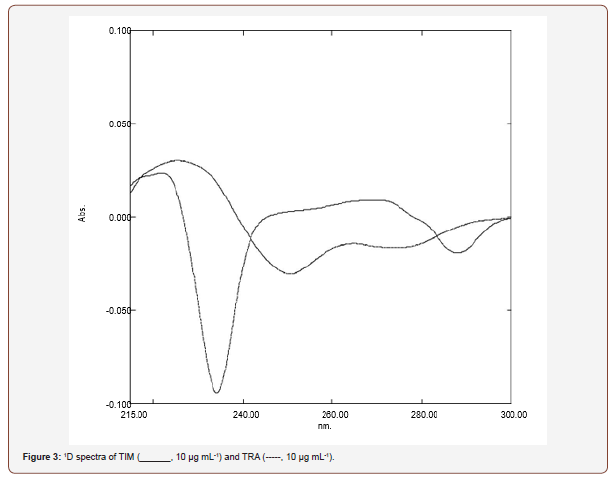
a) First derivative spectrophotometric (1D) method: 1D values of TIM were measured at the zero crossing point of TRA at 226 nm. The 1D value of TRA was measured at 292 nm. For each drug, the calibration graphs were plotted demonstrating the concentration values of 1D amplitude and the regression equations were computed which is further used for calculation of each drug in the sample preparation.
b) Isosbestic point method: The zero order absorption spectra of 10 μg mL-1of each of the studied drugs were recorded as shown in Figure 2. In order to relate the absorbance of the zero order spectra of TIM at their isosbestic points; 230.5 or 272 nm to its corresponding concentrations in μg mL-1. Calibration curves were plotted and the regression equation at each wavelength was derived, illustrated in Table 2. In order to analyze the studied drugs in their binary mixture, different volumes of TRA and TIM were precisely withdrawn from their corresponding working solutions and pipetted into 10 mL volumetric flask to make solutions containing different ratios of each two drugs in their binary mixtures as shown in Figure 2 and then the resultant solution was made up to volume with the same solvent. To calculate the concentration of the studied drugs in their binary mixture, the absorbance of the resulting solution at (1D) 226 nm represented the content of TIM only, which can be obtained using its derived equation at same wave length as shown in Table 2. The total content of each of the prepared binary mixture was determined at their isosbestic points; 230.5 or 272 nm by measuring their corresponding absorbencies at these points and then applied the derived regression equation at each points provided in Table 2. TRA concentration was calculated at each points by subtraction of the concentration of TIMA, determined at (1D) 226 nm, from the total concentrations of both drugs at their isosbestic points (Table 2).
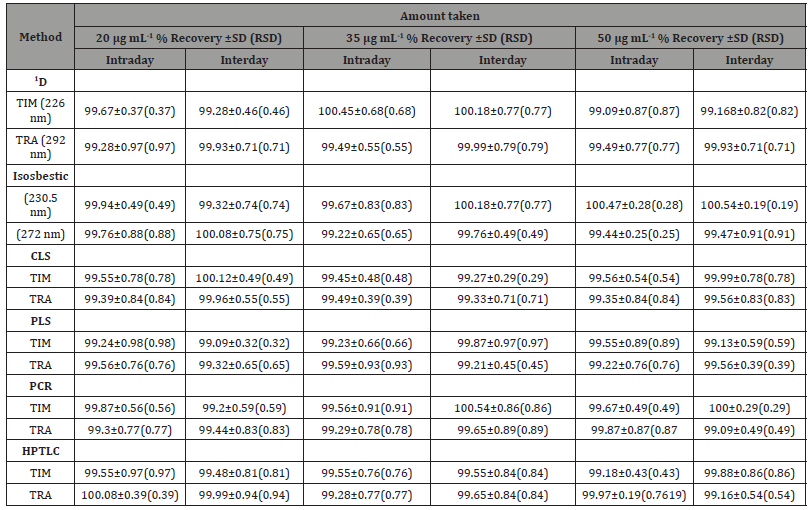
Table 2: Evaluation of the accuracy and precision of the proposed methods
SD: Standard deviation, RSD: Relative standard deviation
Multivariate chemometric methods: Prepare twenty five mixtures of TIM and TRA standard solution; seventeen mixtures were used for building the calibration model, while eight mixtures were chosen to be used as an external validation set. The laboratory prepared mixtures of each of the TIM and TRA were prepared in a concentration range of (0.4-50 μg mL-1) to reach the concentrations listed in Table 3. The absorbance of these mixtures were measured between 200 and 400 nm at 1 nm intervals with respect to a blank of methanol. Several multivariate calibration models were constructed using the data obtained. The concentration of TIM and TRA were calculated by application of the developed models and to analyze the spectra of unknown samples. For construction of the models, to build the CLS, PCR and PLS models, feed the computer with the absorbance and concentration matrices for the training set, use the training set absorbance and concentration matrices using Matlab® (version 7.9), together with PLS-Toolbox 2.0 software for the calculations. The concentrations were calculated from the corresponding regression equations (Table 3).
Table 3: Concentrations of TIM and TRA in the calibration and validation set using PCR, PLS and CLS methods
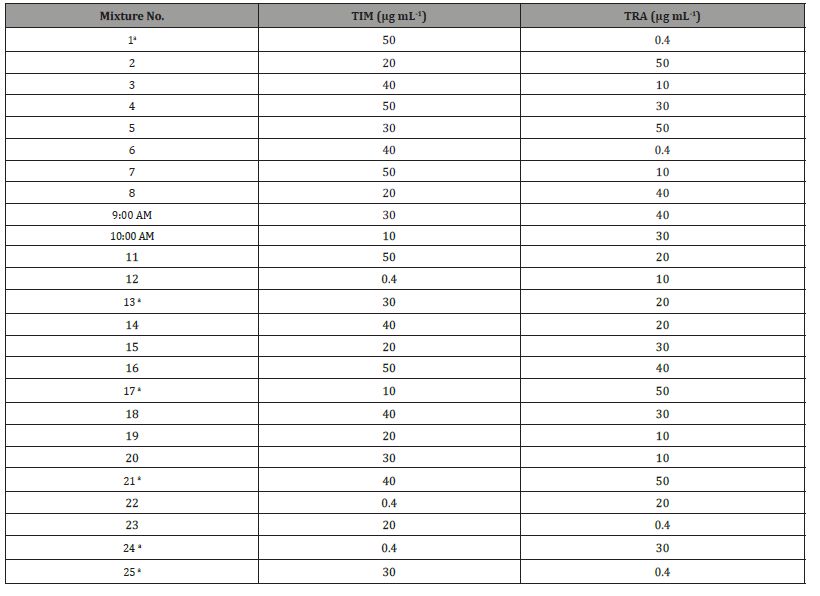
A Mixtures of validation set
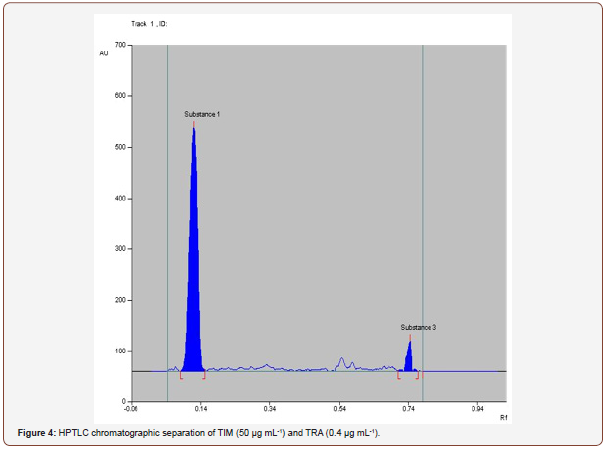
(TLC)-Densitometric methods: The TLC densitometric method was used for the determination of TIM and TRA by separation from each other, depending on the difference in Rf values. Complete separation of TIM from TRA was achieved using ethylacetate:methanol:ammonia (5:3.0:0.5, v/v/v) as the mobile phase. Densitometric scanning was performed at 274 nm with accepted results (Figure 3 & 4).
Results and Discussions
Optimization of variables
Spectro-chemometric method
Spectro-chemometric methods were considered the methods of choice for assay of two component mixtures [24-29]. In this work two spectro-chemometric method such as first derivative (1D) and isosbestic point procedures were developed for the direct determination of TIM and TRA in their dosage form preparation.
Selection of solvent used: Methanol was the solvent of choice for this mixture, where it was found to be the most suitable one for both TIM and TRA from their dosage form. In addition, significant decrease in the degree of overlapping between the two mixture components and higher sensitivity were also observed.
Stability study: The absorbance of the studied drugs was found to be stable for 60 min within 200-350 nm range.
First derivative spectrophotometric (1D) method: In this work, first derivative spectrophotometry was examined for the assay of two component drug mixture. Figure 2 showed that TIM absorption spectrum is overlapped with that of TRA, which in turn made them difficult to be determined simultaneously. In the corresponding 1D curve, provided in Figure 3, the TIM 1D values were located at the zero crossing point of TRA at 226 nm. TRA exhibited a 1D value at 292 nm where TIM first derivative value was nil (Figure 3).
Isosbestic point method: This method is based on the fact that the total concentration of the mixture was determined at their isosbestic points; 230.5 or 272 nm. As illustrated in Figure 2, Thus TIM concentration was determined by the application of first derivative spectrophotometric technique by measuring the absolute value of absorption spectra at its 1D, ʎmax 226 nm without any interference from TRA. Then the concentration of TRA in the accompanied mixture at 230.5 or 272 nm was calculated as explained under 4.4.1.2.
Multivariate Chemometric methods
Among the different regression method existed for multivariate calibration, the factor analysis based methods including partial least squares (PLS regression and principal component regression (PCR) have received considerable attention in the chemometrics literature [30-34]. Due to the overlapped spectra of the drugs, (Figure 2), the previous chemometric methods have been used to analyze this mixture. An appropriate choice of the number of principal components or factors is necessary for PCR, PLS and CLS calibrations. The number of factors should account as much as possible for the experimental data without resulting in over fitting. Various criteria have been developed to select the optimum number [35]. Cross-validation methods leaving out one sample at a time was employed [36]. The predicted concentrations were compared with the known concentrations of the compounds in each calibration sample. The root mean squares error of cross-validation (RMSECV) was calculated for each method for examining the errors in the predicted concentrations. The optimum number of factors was selected by following the criterion of Haal and and Thomas [37]. The selected model was that with the smallest number of factors such that RMSECV for that model was not significantly greater than RMSECV from the model with additional factor. A number of factors were found to be optimum for the mixture of TIM and TRA using PLS, PCR and CLS, Figure 5,6 respectively. To assess the prediction ability of the suggested models, an external validation set was used. The root mean squared error of prediction (RMSEP) values were calculated [38] Table 1. The percentage recoveries of the validation samples are shown in Table 2. The suggested methods were valid and applicable for the analysis of TIM and TRA in Avatan-T® eye drops Table 4. The validity of the proposed method is further assessed by applying the standard addition technique. The results obtained are shown in Table 5 (Table 4 &5 and Figure 5&6).
Table 4: Determination of the studied drugs in their pharmaceutical dosage form using the proposed methods compared to reference method.
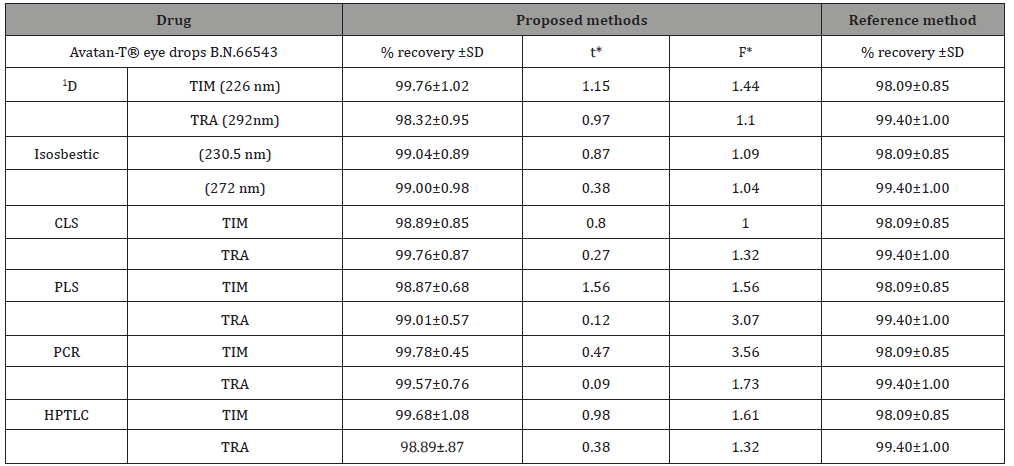
*Tabulated value for the proposed methods and reported HPLC method (n=4) at 95% confidence limit; t=2.45 and F=9.28.
Table 5: Determination of the studied drugs in their pharmaceutical dosage form using standard addition technique.
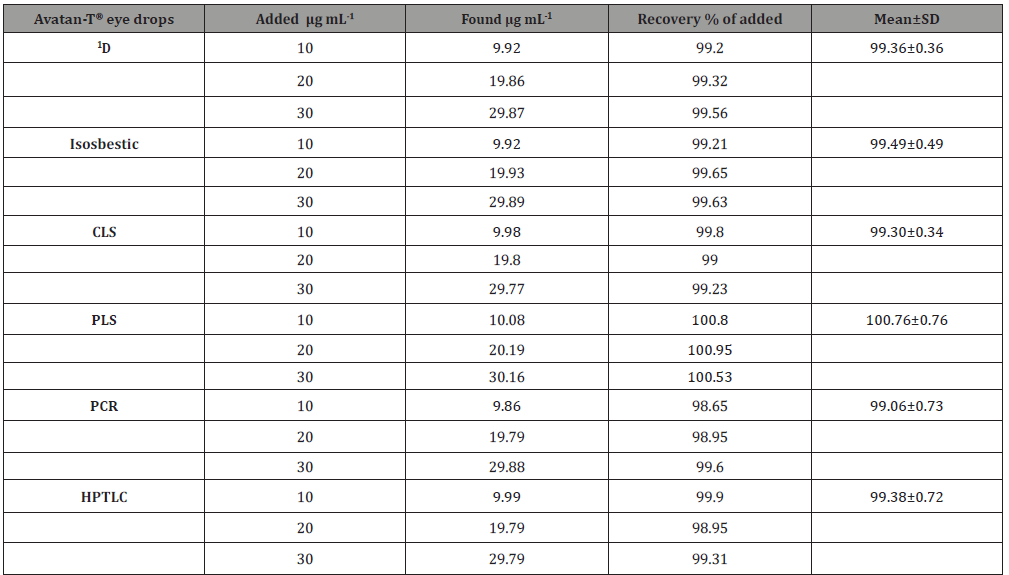
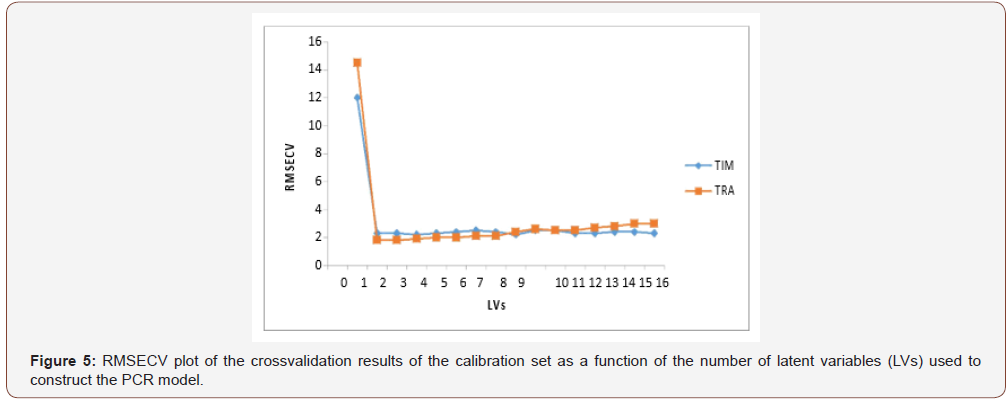
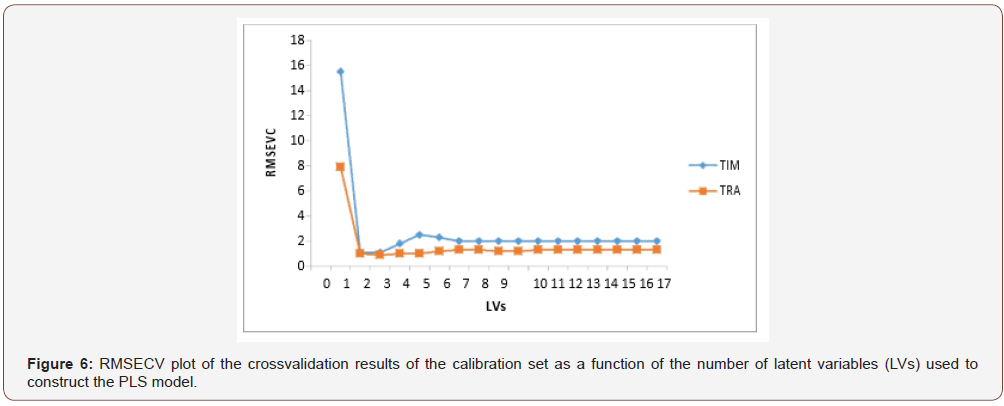
Table 6: Statistical analysis of parameters required for system suitability testing of TLC method.
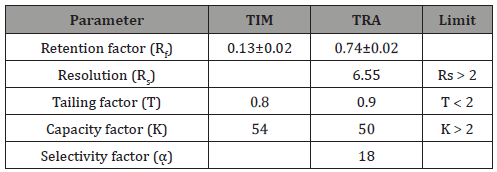
(TLC)-Densitometric methods
The current work discussed the implementation of a newly developed HPTLC with regard to direct determination of TIM and TRA in their dosage form preparation without prior separation.
Optimization: The TLC densitometric method was used for the determination of TIM and TRA by separation from each other, depending on the difference in Rf values. Complete separation products was achieved using ethylacetate:methanol:ammonia (5.0:3.0:0.5, v/v/v) as the mobile phase. Densitometric scanning was performed at 274 nm with accepted results Figure 4.
Solution stability: The stability of TRA and TIM in their both standard and pharmaceutical preparation solutions was investigated. This was done by storing solutions of the two drugs at room temperature for different time intervals (1, 3 and 5 h) before being analyzed by the proposed method. No decomposition of the drugs was observed during development which was confirmed by the absence of any additional peaks in the chromatograms obtained throughout the analysis time together with the nearly unchangeable peak area of the drugs during stability studies (RSD % less than 2%) indicating stability of the drugs solutions for at least 5 h, which was enough for completing the analytical procedure.
Spot stability: The time for which the sample stands on the plate between spotting and chromatographic development can affect its stability and should be assessed for validation. Twodimensional chromatography was applied to study decomposition occurring during spotting and development. Appearance of peak (s) of decomposition product (s) in both the first and second development directions indicates decomposition during development. Using the proposed conditions, no decomposition was observed during spotting and development indicating stability of the four drugs in their solutions.
Validation of the current procedures
The suggested spectro-chemometric, multivariate chemometric and HPTLC procedures were validated according to USP [39] and ICH [40] guidelines.
Linearity and analytical parameters: Upon application of the optimized experimental conditions, for all the procedures studied, the least-squares regression analysis was applied to compute the regression equations for each drug under study as explained under the general procedure 2.4., and the results obtained are summarized in Table 1. In all cases, the analytical parameters such as linear range, the intercepts (a), slopes (b), correlation coefficients (r), determination coefficients (r2), limits of detection (LOD) and limits of quantitation (LOQ) are included. The slopes are used as measure of sensitivity of the suggested methods, while intercepts indicate the magnitude of background interferences. In all methods applied, the results listed in Table 1 indicate the high sensitivity and low background effects. The obtained values of correlation coefficients (r) and determination coefficients (r2) confirmed a linear relationship between the response measured at the chosen wavelength(s) and the selected concentrations of both drugs in the range specified.
Accuracy and precision: Accuracy and precision of the current procedures were studied at three various levels of the cited drugs concentrations. In this study each of the chosen concentration was analyzed six times by the proposed methods. Table 2 summarizes the results of such study. These results were quite satisfactory reflecting good accuracy of the current procedures. The computed relative standard deviations were found to be below 2% for all procedures studied proving perfect precision of all suggested methods. In addition, the suggested methods were used for the analyses of TIM and TRA in prepared laboratory mixtures with various ratios of both drugs ranged from 1: 1 to 1:125. The percentage recoveries in all cases were satisfactory and the calculated relative standard deviation values for both drugs were below 2 reflecting good accuracy and precision of the suggested procedures.
Specificity and interference: This study has been done by all the proposed methods through analysis of pharmaceutical preparation extract by standard addition method where the samples under study were spiked separately with certain concentration of the investigated drugs in different ratios. In all cases, satisfactory % recovery with relative standard deviation value for both drugs did not exceed 2 were obtained; indicating that no interference is observed from the matrix background
Analyses of available dosage form: The suggested procedures were used for the direct estimation of TIM and TRA in Avatan-T® eye drops and the results obtained were contrasted with those obtained upon application of reference method [1] as illustrated in Table 1. Statistical analysis of the obtained results using Fand t-tests shows that there is no remarkable differences at 95% confidence level. As can be seen, the percentage recoveries in all cases were satisfactory for both drugs reflecting good accuracy, precision and the applicability of the suggested methods to the pharmaceutical preparations.
Robustness: Robustness of the proposed methods was investigated by studying the effect of small change in the experimental parameter(s) on the analytical performance of the method. In this study the parameter under study was changed while the others were kept the same. In case of chemometric and HPTLC methods, variation of wavelength of detection ± 2 nm were tried. In all cases the general procedure was applied and the percentage recovery was computed. It was clear that small variation of the variables studied has no significant influence the efficiency of the method under study. Therefore the proposed methods are reliable with regard to the analyses of the chosen drugs in either bulk forms or their dosage forms.
Conclusion
The current research work describes simple, sensitive, reliable, accurate, reproducible, time saving and economic two spectro-Chemometric, three multivariate chemometric and HPTLC procedures with regard to the direct estimation of the studied drugs in their binary mixture and in the available dosage form. The most important features of these methods are no tedious sample preparation or treatment such as heating, derivatization which may needed especially for HPLC procedure. For HPTLC the cited drugs were detected simultaneously within a period of time less than 8 min. The current procedures were evaluated according to USP and ICH rules where acceptable regression values, RSD % and standard deviations were observed, thus make them versatile and valuable for simultaneous estimation of two drugs in their formulation. Data obtained after analysis of the studied formulations by the suggested methods were too close to label claims, which reflect absence of interference from the accompanied excipients during estimation of the cited drugs by the proposed procedures. Owing to the suitability of the suggested procedures with regard to the routine analyses of the dosage forms of these drugs, they may be used in quality control for these products.
To read more about this article...Open access Journal of Pharmacy & Pharmacology Research
Please follow the URL to access more information about this article
To know more about our Journals...Iris Publishers


No comments:
Post a Comment